Code
data(rmb_datasets, package = "rmb")
rmb_datasets$study_design[rmb_datasets$object == "phototherapy"]
#> [1] "Observational neonatal jaundice cohort used for confounding-adjusted phototherapy analyses."This article applies a logistic regression workflow to the phototherapy dataset, examining whether phototherapy reduces the risk of exceeding the transfusion threshold in neonates with jaundice.
Neonatal jaundice (hyperbilirubinemia) affects the majority of newborns and, when severe, can cause neurological injury. Phototherapy is the first-line treatment to lower total serum bilirubin (TSB), yet observational studies must adjust for gestational age and birth weight because preterm and low-birthweight infants both receive phototherapy more often and are at higher risk of complications. These data were assembled for confounding-adjusted phototherapy analyses described in RMB2e Chapter 9.
data(rmb_datasets, package = "rmb")
rmb_datasets$study_design[rmb_datasets$object == "phototherapy"]
#> [1] "Observational neonatal jaundice cohort used for confounding-adjusted phototherapy analyses."Is phototherapy use associated with a reduced rate of exceeding the transfusion threshold after adjusting for gestational age and birth weight?
set.seed(42)
dag <- ggdag::dagify(
  ot ~ gest + bwt + pt + tsb,
  pt ~ gest + bwt,
  labels = c(
    ot = "Over transfusion threshold",
    pt = "Phototherapy",
    gest = "Gestational age",
    bwt = "Birth weight",
    tsb = "Serum bilirubin"
  ),
  exposure = "pt",
  outcome = "ot"
)
ggdag::ggdag(dag, use_labels = "label", text = FALSE) +
  ggdag::theme_dag_blank() +
  ggplot2::labs(title = "Phototherapy: Causal DAG")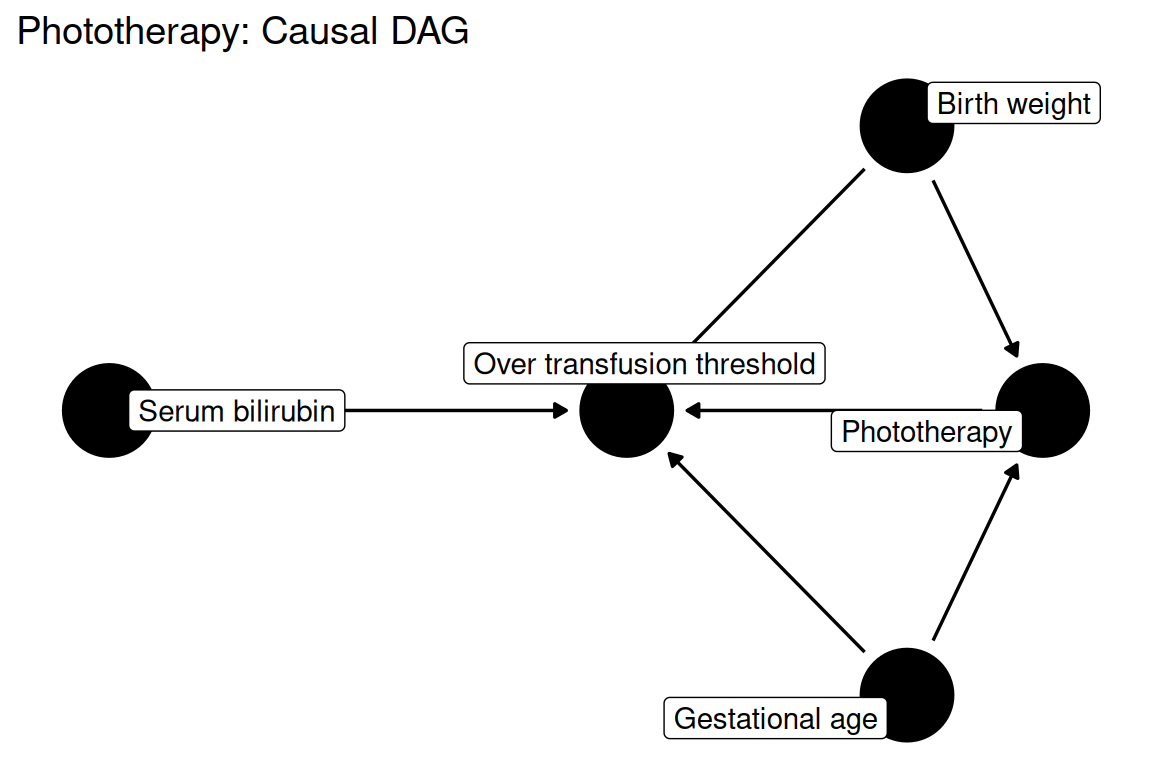
data(phototherapy, package = "rmb")
dat <- phototherapy
dim(dat)
#> [1] 20731    11
summary(haven::zap_labels(dat[c("phototherapy", "over_thresh", "qual_TSB", "birth_wt", "gest_age", "male", "age_days")]))
#>   phototherapy     over_thresh          qual_TSB        birth_wt
#>  Min.   :0.0000   Min.   :0.000000   Min.   :1.000   Min.   :2.000
#>  1st Qu.:0.0000   1st Qu.:0.000000   1st Qu.:1.000   1st Qu.:2.900
#>  Median :0.0000   Median :0.000000   Median :2.000   Median :3.300
#>  Mean   :0.2211   Mean   :0.006174   Mean   :2.762   Mean   :3.324
#>  3rd Qu.:0.0000   3rd Qu.:0.000000   3rd Qu.:4.000   3rd Qu.:3.700
#>  Max.   :1.0000   Max.   :1.000000   Max.   :6.000   Max.   :6.000
#>     gest_age          male           age_days
#>  Min.   :35.00   Min.   :0.0000   Min.   :0.000
#>  1st Qu.:37.00   1st Qu.:0.0000   1st Qu.:1.000
#>  Median :39.00   Median :1.0000   Median :2.000
#>  Mean   :38.37   Mean   :0.5796   Mean   :2.018
#>  3rd Qu.:40.00   3rd Qu.:1.0000   3rd Qu.:3.000
#> Max. :41.00 Max. :1.0000 Max. :4.000Logistic regression is used to model the binary outcome over_thresh (TSB exceeding the transfusion threshold), with phototherapy as the primary predictor and gestational age and birth weight as confounders (RMB2e Ch. 9).
formula_main <- over_thresh ~ phototherapy + birth_wt + gest_age
formula_main
#> over_thresh ~ phototherapy + birth_wt + gest_agewith(dat, table(phototherapy, over_thresh))
#> over_thresh
#> phototherapy 0 1
#> 0 16034 113
#> 1 4569 15
with(dat, prop.table(table(phototherapy, over_thresh), margin = 1))
#> over_thresh
#> phototherapy 0 1
#> 0 0.993001796 0.006998204
#> 1 0.996727749 0.003272251
summary(haven::zap_labels(dat[c("birth_wt", "gest_age", "qual_TSB")]))
#> birth_wt gest_age qual_TSB
#> Min. :2.000 Min. :35.00 Min. :1.000
#> 1st Qu.:2.900 1st Qu.:37.00 1st Qu.:1.000
#> Median :3.300 Median :39.00 Median :2.000
#> Mean :3.324 Mean :38.37 Mean :2.762
#> 3rd Qu.:3.700 3rd Qu.:40.00 3rd Qu.:4.000
#> Max. :6.000 Max. :41.00 Max. :6.000dat$phototherapy_plot <- factor(
dat$phototherapy,
levels = c(0, 1),
labels = c("No", "Yes")
)
ggplot2::ggplot(dat, ggplot2::aes(x = phototherapy_plot, y = gest_age, fill = phototherapy_plot)) +
ggplot2::geom_boxplot() +
ggplot2::scale_fill_manual(values = c("#1b9e77", "#d95f02")) +
ggplot2::labs(
title = "Gestational age by phototherapy group",
x = "Phototherapy",
y = "Gestational age (weeks)"
) +
ggplot2::theme_minimal() +
ggplot2::theme(legend.position = "none")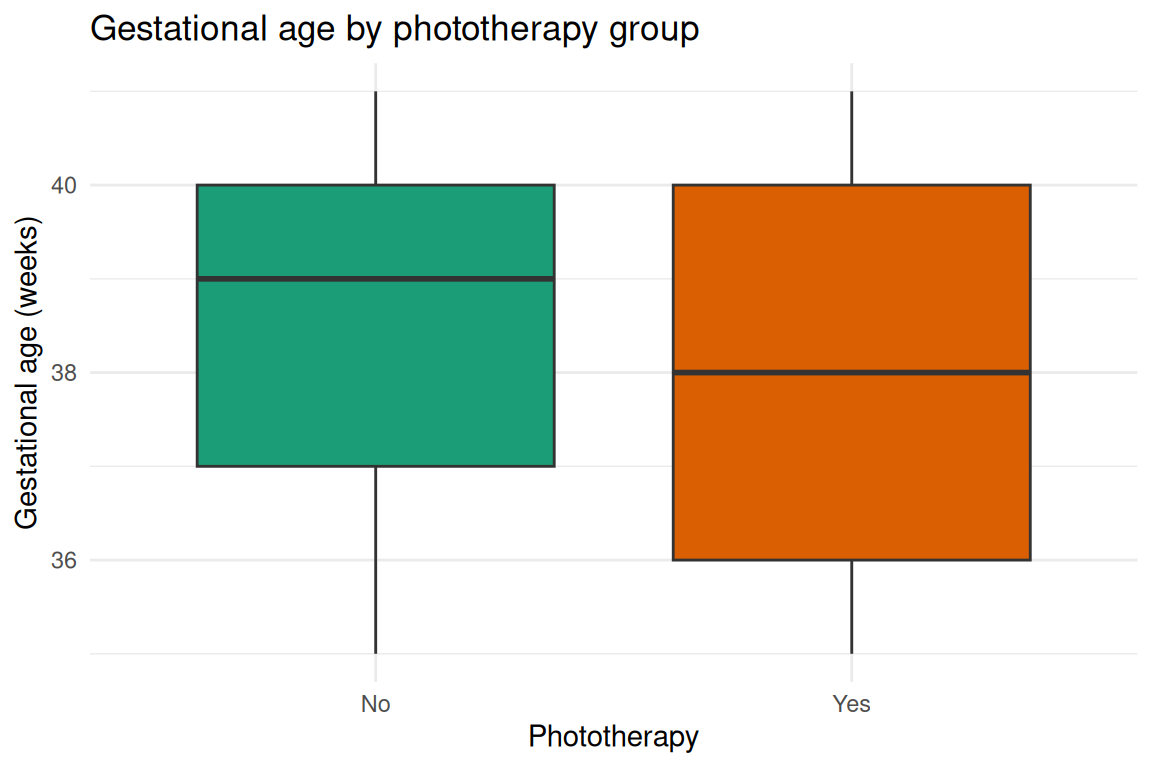
fit <- stats::glm(formula_main, data = dat, family = stats::binomial())
summary(fit)
#>
#> Call:
#> stats::glm(formula = formula_main, family = stats::binomial(),
#>     data = dat)
#>
#> Coefficients:
#>              Estimate Std. Error z value Pr(>|z|)
#> (Intercept)  17.10863    2.24672   7.615 2.64e-14 ***
#> phototherapy -1.21157    0.28061  -4.318 1.58e-05 ***
#> birth_wt      0.39277    0.18993   2.068   0.0386 *
#> gest_age     -0.61776    0.06803  -9.081  < 2e-16 ***
#> ---
#> Signif. codes:  0 '***' 0.001 '**' 0.01 '*' 0.05 '.' 0.1 ' ' 1
#>
#> (Dispersion parameter for binomial family taken to be 1)
#>
#>     Null deviance: 1557.6  on 20730  degrees of freedom
#> Residual deviance: 1443.0  on 20727  degrees of freedom
#> AIC: 1451
#>
#> Number of Fisher Scoring iterations: 8data.frame(
model = "adjusted",
AIC = stats::AIC(fit),
deviance = fit$deviance,
null_deviance = fit$null.deviance
)
#> model AIC deviance null_deviance
#> 1 adjusted 1450.997 1442.997 1557.571or <- exp(stats::coef(fit))
ci <- exp(stats::confint(fit))
data.frame(
term = names(or),
odds_ratio = unname(or),
conf_low = ci[, 1],
conf_high = ci[, 2],
p_value = summary(fit)$coefficients[, "Pr(>|z|)"]
)
#> term odds_ratio conf_low conf_high p_value
#> (Intercept) (Intercept) 2.692673e+07 3.442282e+05 2.321909e+09 2.638232e-14
#> phototherapy phototherapy 2.977289e-01 1.650710e-01 4.998177e-01 1.577238e-05
#> birth_wt birth_wt 1.481076e+00 1.013495e+00 2.133724e+00 3.864252e-02
#> gest_age gest_age 5.391533e-01 4.711359e-01 6.152494e-01 1.079584e-19After adjustment for gestational age and birth weight, the estimated association between phototherapy use and exceeding the transfusion threshold reflects the confounding-adjusted treatment effect described in RMB2e Chapter 9. Because gestational age and birth weight are both strong predictors of the outcome and strongly related to phototherapy receipt, unadjusted comparisons would be severely confounded. The logistic model framework here illustrates the core confounding-adjustment strategy recommended throughout RMB2e.