Code
data(rmb_datasets, package = "rmb")
rmb_datasets$study_design[rmb_datasets$object == "hers_nodm_visit4_only"]
#> [1] "Cross-sectional Visit 4 subset of HERS participants without diabetes."This article examines missing glucose data patterns at Visit 4 in HERS participants without diabetes, illustrating missing data mechanisms described in RMB2e Chapter 11.
Missing data are a pervasive challenge in longitudinal clinical studies. In HERS, fasting glucose was measured repeatedly but subject to informative missingness— women who missed visits or had missing glucose values may differ systematically from completers. RMB2e Chapter 11 uses this dataset to illustrate missing-at-random (MAR) and missing-not-at-random (MNAR) mechanisms.
data(rmb_datasets, package = "rmb")
rmb_datasets$study_design[rmb_datasets$object == "hers_nodm_visit4_only"]
#> [1] "Cross-sectional Visit 4 subset of HERS participants without diabetes."We ask: among HERS participants without diabetes at Visit 4, is missingness of fasting glucose associated with BMI category and other baseline characteristics, suggesting non-random missingness?
set.seed(42)
dag <- ggdag::dagify(
  miss ~ bmi + age + smoke + htn + drink,
  labels = c(
    miss = "Missing glucose",
    bmi = "BMI category",
    age = "Age",
    smoke = "Smoking",
    htn = "HTN meds",
    drink = "Alcohol use"
  ),
  outcome = "miss"
)
ggdag::ggdag(dag, use_labels = "label", text = FALSE) +
  ggdag::theme_dag_blank() +
  ggplot2::labs(title = "HERS visit 4: Missing data DAG")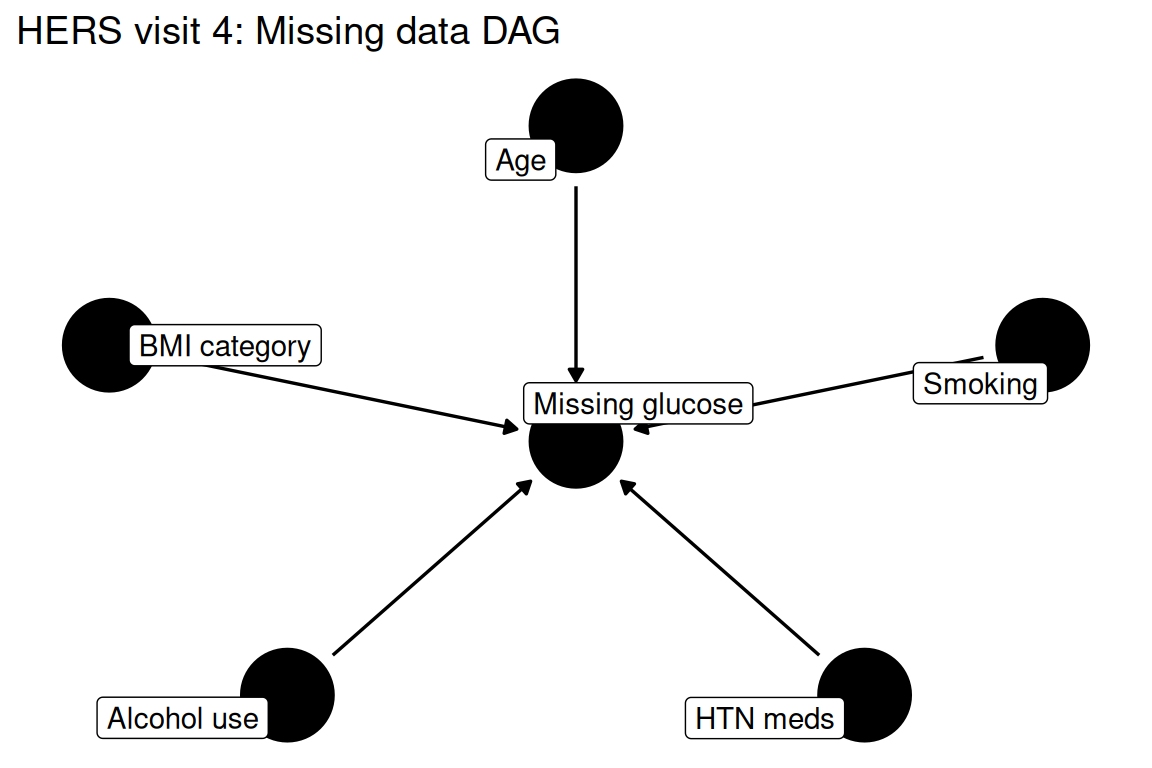
data(hers_nodm_visit4_only, package = "rmb")
dat <- hers_nodm_visit4_only
dim(dat)
#> [1] 1871   31
summary(haven::zap_labels(dat[c("miss_gluc", "bmi_cat", "age", "csmker", "htnmeds", "drinkany")]))
#>    miss_gluc         bmi_cat           age            csmker
#>  Min.   :0.0000   Min.   :1.000   Min.   :44.00   Min.   :0.0000
#>  1st Qu.:0.0000   1st Qu.:2.000   1st Qu.:61.00   1st Qu.:0.0000
#>  Median :0.0000   Median :3.000   Median :66.00   Median :0.0000
#>  Mean   :0.2368   Mean   :2.997   Mean   :65.93   Mean   :0.1322
#>  3rd Qu.:0.0000   3rd Qu.:4.000   3rd Qu.:71.00   3rd Qu.:0.0000
#>  Max.   :1.0000   Max.   :5.000   Max.   :79.00   Max.   :1.0000
#>                   NAs    :110                     NAs    :63
#>     htnmeds         drinkany
#>  Min.   :0.000   Min.   :0.0000
#>  1st Qu.:1.000   1st Qu.:0.0000
#>  Median :1.000   Median :0.0000
#>  Mean   :0.853   Mean   :0.3938
#>  3rd Qu.:1.000   3rd Qu.:1.0000
#>  Max.   :1.000   Max.   :1.0000
#> NAs :63We fit logistic regression to predict glucose missingness (miss_gluc) from BMI category, age, smoking status, hypertension medication use, and alcohol consumption.
formula_miss <- miss_gluc ~ bmi_cat + age + csmker + drinkany + htnmeds
formula_miss
#> miss_gluc ~ bmi_cat + age + csmker + drinkany + htnmedsmiss_by_bmi <- with(dat, tapply(miss_gluc, bmi_cat, mean, na.rm = TRUE))
miss_df <- data.frame(
bmi_cat = names(miss_by_bmi),
prop_missing = as.numeric(miss_by_bmi)
)
ggplot2::ggplot(miss_df, ggplot2::aes(x = bmi_cat, y = prop_missing)) +
ggplot2::geom_col(fill = "grey70") +
ggplot2::labs(
title = "HERS Visit 4: Glucose missingness by BMI quintile",
x = "BMI category (quintile)",
y = "Proportion with missing glucose"
) +
ggplot2::theme_minimal()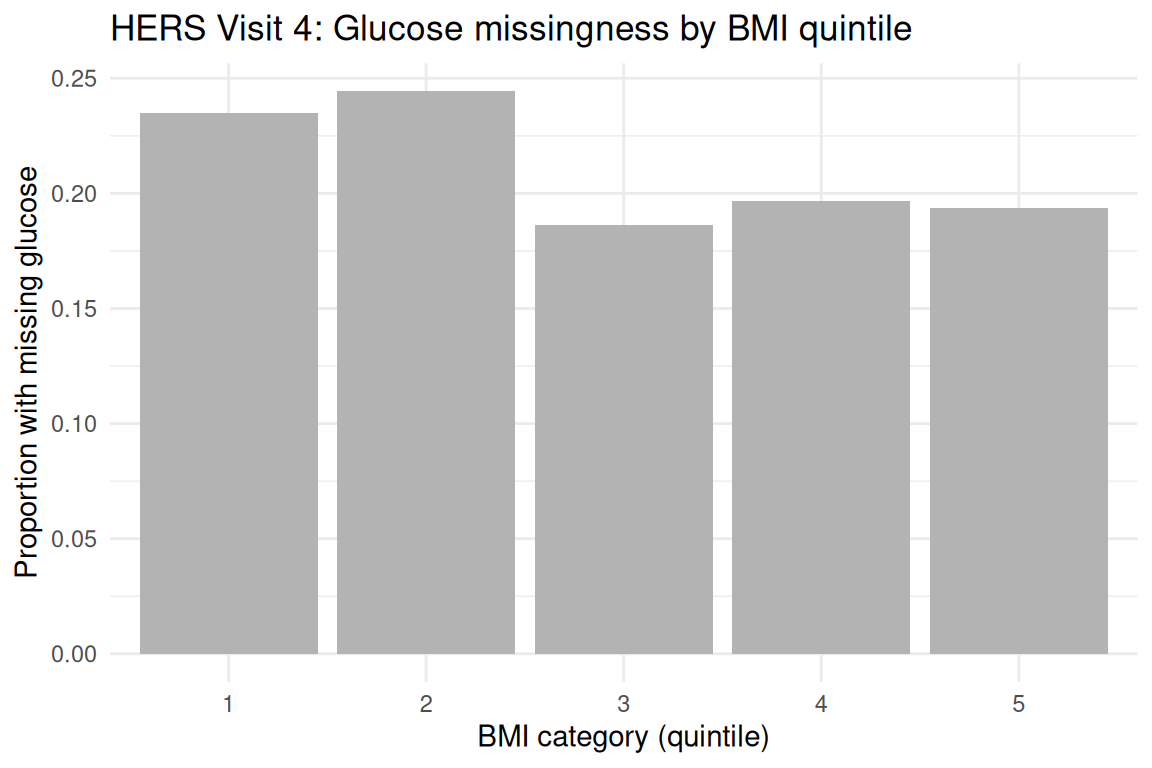
fit_miss <- stats::glm(formula_miss, data = dat, family = stats::binomial())
summary(fit_miss)
#>
#> Call:
#> stats::glm(formula = formula_miss, family = stats::binomial(),
#>     data = dat)
#>
#> Coefficients:
#>              Estimate Std. Error z value Pr(>|z|)
#> (Intercept)  0.996734   0.678388   1.469  0.14176
#> bmi_cat     -0.094452   0.043663  -2.163  0.03053 *
#> age         -0.030779   0.009536  -3.228  0.00125 **
#> csmker       0.072864   0.175978   0.414  0.67884
#> drinkany     0.158861   0.120222   1.321  0.18637
#> htnmeds     -0.106962   0.162695  -0.657  0.51090
#> ---
#> Signif. codes:  0 '***' 0.001 '**' 0.01 '*' 0.05 '.' 0.1 ' ' 1
#>
#> (Dispersion parameter for binomial family taken to be 1)
#>
#>     Null deviance: 1779.5  on 1722  degrees of freedom
#> Residual deviance: 1761.3  on 1717  degrees of freedom
#>   (148 observations deleted due to missingness)
#> AIC: 1773.3
#>
#> Number of Fisher Scoring iterations: 4data.frame(
model = "missingness model",
AIC = stats::AIC(fit_miss),
n_obs = nobs(fit_miss)
)
#> model AIC n_obs
#> 1 missingness model 1773.338 1723or <- exp(stats::coef(fit_miss))
ci <- exp(stats::confint(fit_miss))
inf <- data.frame(
term = names(or),
odds_ratio = unname(or),
conf_low = ci[, 1],
conf_high = ci[, 2],
p_value = summary(fit_miss)$coefficients[, "Pr(>|z|)"]
)
inf
#> term odds_ratio conf_low conf_high p_value
#> (Intercept) (Intercept) 2.7094193 0.7150214 10.2317462 0.141759606
#> bmi_cat bmi_cat 0.9098718 0.8350393 0.9910184 0.030527487
#> age age 0.9696895 0.9516996 0.9879715 0.001248205
#> csmker csmker 1.0755841 0.7564607 1.5095678 0.678836465
#> drinkany drinkany 1.1721747 0.9253774 1.4828658 0.186369687
#> htnmeds htnmeds 0.8985597 0.6567238 1.2438365 0.510898512Missingness of fasting glucose at Visit 4 is associated with BMI category and other participant characteristics, indicating that the missing data mechanism is not completely at random (MCAR). This pattern motivates the multiple imputation approach demonstrated in RMB2e Chapter 11, where MAR-based imputation accounts for the observed predictors of missingness to produce valid inference about the glucose outcome.