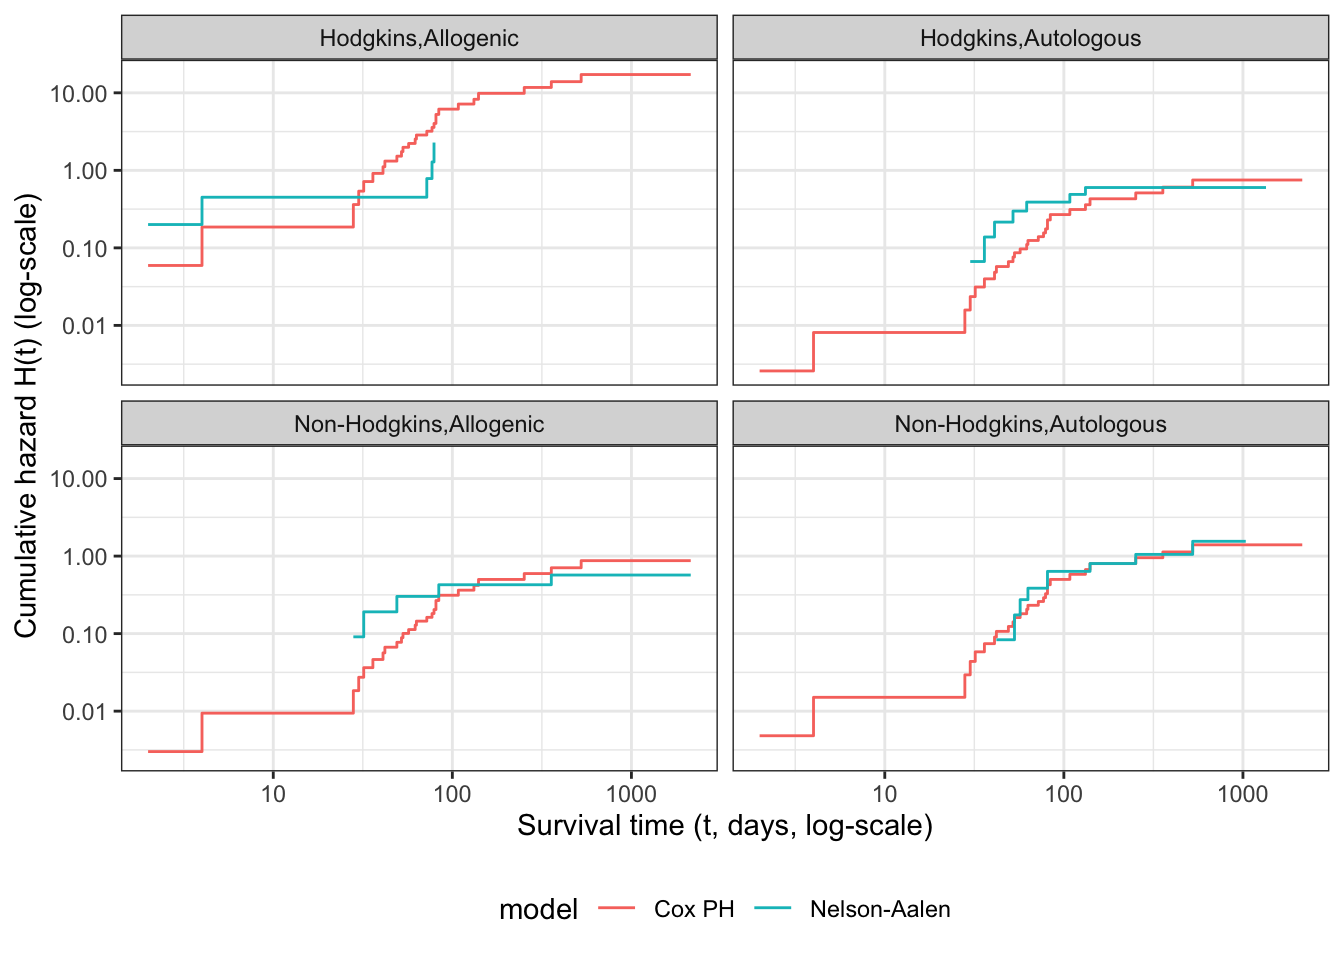
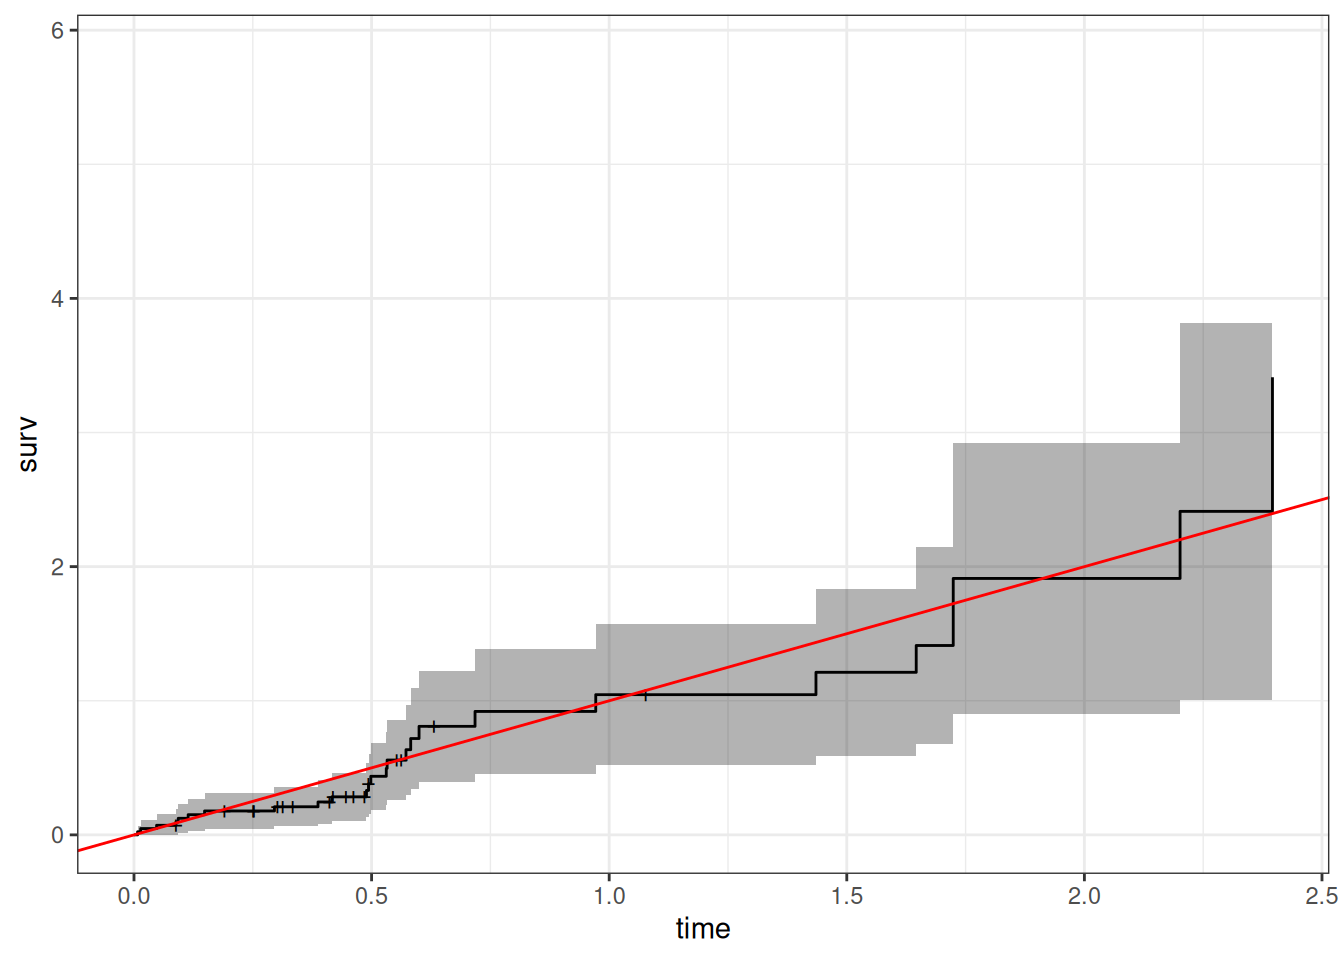
Understanding proportional hazards models
Let’s make two generalizations. First, we let the hazard depend on some covariates \(x_1,x_2, \dots, x_p\); we will indicate this dependence by extending our notation for hazard:
Definition 7.1 (conditional hazard) The conditional hazard of outcome \(T\) at value \(t\), given covariate vector \(\tilde{x}\), is the conditional density of the event \(T=t\), given \(T \ge t\) and \(\tilde{X}= \tilde{x}\):
\[{\lambda}(t|\tilde{x}) \stackrel{\text{def}}{=}\text{p}(T=t|T\ge t, \tilde{X}= \tilde{x}) \tag{7.1}\]
Definition 7.2 (baseline hazard)
The baseline hazard, base hazard, or reference hazard, denoted \({\lambda}_0(t)\) or \(\lambda_0(t)\), is the hazard function for the subpopulation of individuals whose covariates are all equal to their reference levels:
\[{\lambda}_0(t) \stackrel{\text{def}}{=}{\lambda}(t | \tilde{X}= \tilde{0}) \tag{7.2}\]
The baseline hazard is somewhat analogous to the intercept term in linear regression, but it is not a mean.
Definition 7.3 (baseline cumulative hazard)
The baseline cumulative hazard, base cumulative hazard, or reference cumulative hazard, denoted \(H_0(t)\) or \(\Lambda_0(t)\), is the cumulative hazard function (Definition 6.5) for the subpopulation of individuals whose covariates are all equal to their reference levels:
\[{\Lambda}_0(t) \stackrel{\text{def}}{=}{\Lambda}(t | \tilde{X}= \tilde{0}) \tag{7.3}\]
Definition 7.4 (Baseline survival function) The baseline survival function is the survival function for an individual whose covariates are all equal to their default values.
\[\text{S}_0(t) \stackrel{\text{def}}{=}\text{S}(t | \tilde{X}= \tilde{0})\]
Now, let’s define how the hazard function depends on covariates. We typically use a log link to model the relationship between the hazard function, \({\lambda}(t|\tilde{x})\), and the linear component, \(\eta(t|\tilde{x})\), as we did for Poisson models in Chapter 4; that is:
Definition 7.5 (log-hazard)
The log-hazard function, denoted \(\eta(t)\), is the natural logarithm of the hazard function:
\[\eta(t) \stackrel{\text{def}}{=}\text{log}{\left\{{\lambda}(t)\right\}}\]
Definition 7.6 (conditional log-hazard)
The conditional log-hazard function, denoted \(\eta(t|\tilde{x})\), is the natural logarithm of the conditional hazard function:
\[\eta(t | \tilde{x}) \stackrel{\text{def}}{=}\text{log}{\left\{{\lambda}(t | \tilde{x})\right\}}\]
In contrast with Poisson regression, here \(\eta(t|\tilde{x})\) depends on both \(t\) and \(\tilde{x}\).
Definition 7.7 (baseline log-hazard)
The baseline log-hazard, denoted \(\eta_0(t)\), log-hazard function for the subpopulation of individuals whose covariates are all equal to their reference levels:
\[\eta_0(t) \stackrel{\text{def}}{=}\eta(t | \tilde{X}= \tilde{0})\]
Theorem 7.1 \[
\begin{aligned}
{\lambda}(t|\tilde{x}) &= \text{exp}{\left\{\eta(t|\tilde{x})\right\}}
\end{aligned}
\]
Definition 7.8 (difference in log-hazards) The difference in log-hazards between covariate patterns \(\tilde{x}\) and \({\tilde{x}^*}\) at time \(t\) is:
\[\Delta \eta(t|\tilde{x}: {\tilde{x}^*}) \stackrel{\text{def}}{=}\eta(t|\tilde{x}) - \eta(t|{\tilde{x}^*})\]
Theorem 7.2 (Difference of log-hazards vs hazard ratio) If \(\Delta \eta(t|\tilde{x}: {\tilde{x}^*})\) is the difference in log-hazard between covariate patterns \(\tilde{x}\) and \({\tilde{x}^*}\) at time \(t\), and \(\theta(t| \tilde{x}: {\tilde{x}^*})\) is corresponding hazard ratio, then:
\[\Delta \eta(t|\tilde{x}: {\tilde{x}^*})= \text{log}{\left\{\theta(t| \tilde{x}: {\tilde{x}^*})\right\}}\]
Proof. Using Definition 6.4:
\[
\begin{aligned}
\Delta \eta(t|\tilde{x}: {\tilde{x}^*})
&\stackrel{\text{def}}{=}\eta(t|\tilde{x}) - \eta(t|{\tilde{x}^*})
\\
&= \text{log}{\left\{{\lambda}(t|\tilde{x})\right\}} - \text{log}{\left\{{\lambda}(t|{\tilde{x}^*})\right\}}
\\
&= \text{log}{\left\{\frac{{\lambda}(t|\tilde{x})}{{\lambda}(t|{\tilde{x}^*})}\right\}}
\\
&= \text{log}{\left\{\theta(t| \tilde{x}: {\tilde{x}^*})\right\}}
\end{aligned}
\]
Corollary 7.1 (Hazard ratio vs difference of log-odds) \[\theta(t| \tilde{x}: {\tilde{x}^*}) = \text{exp}{\left\{\Delta \eta(t|\tilde{x}: {\tilde{x}^*})\right\}}\]
Definition 7.9 (difference in log-hazard from baseline)
The difference in log-hazard for covariate pattern \(\tilde{x}\) compared to the baseline covariate pattern \(\tilde{0}\) is:
\[
\begin{aligned}
\Delta \eta(t|\tilde{x})
&\stackrel{\text{def}}{=}\Delta \eta(t | \tilde{x}: \tilde{0})
\end{aligned}
\]
Theorem 7.3 (Decomposition of log-hazard) \[
\begin{aligned}
\eta(t|\tilde{x}) = \eta_0(t) + \Delta \eta(t|\tilde{x})
\end{aligned}
\]
Definition 7.10 (Hazard ratio versus baseline) \[\theta(t|\tilde{x}) \stackrel{\text{def}}{=}\theta(t| \tilde{x}: \tilde{0}) \tag{7.4}\]
Corollary 7.2 \[\theta(t|\tilde{x})= \text{exp}{\left\{\Delta \eta(t|\tilde{x})\right\}}\]
Proof. \[
\begin{aligned}
\theta(t|\tilde{x})
&\stackrel{\text{def}}{=}\theta(t| \tilde{x}: \tilde{0})
\\
&= \text{exp}{\left\{\Delta \eta(t|\tilde{x})\right\}}
\end{aligned}
\]
Corollary 7.3 \[\Delta \eta(t|\tilde{x}) = \text{log}{\left\{\theta(t| \tilde{x})\right\}}\]
As the second generalization, we let the base hazard, cumulative hazard, and survival functions depend on \(t\), but not on any covariates (for now). We can do this using either parametric or semi-parametric approaches.
Definition 7.11 (Proportional hazards model) A proportional hazards model for a time-to-event outcome \(T\) is a model where the difference in log-hazard from the baseline log-hazard is equal to a linear combination of the predictors:
\[\Delta \eta(t|\tilde{x}) = \tilde{x}\cdot \tilde{\beta} \tag{7.5}\]
Equivalently:
Lemma 7.1 In a proportional hazards model (that is, if Equation 7.5 holds):
\[
\begin{aligned}
\eta(t|\tilde{x}) &= \eta_0(t) + \tilde{x}\cdot \tilde{\beta}
\\
&= \eta_0(t) + \beta_1 x_1+ \dots + \beta_p x_p
\end{aligned}
\tag{7.6}\]
In a proportional hazards model, the baseline log-hazard is analogous to the intercept term in a generalized linear model, except that the baseline log-hazard depends on time, \(t\).
Lemma 7.2 If \(\eta(t|\tilde{x}) = \eta_0(t) + \tilde{x}\cdot \tilde{\beta}\), then:
\[
\begin{aligned}
\Delta \eta(t|\tilde{x}: {\tilde{x}^*})
&= (\tilde{x}- {\tilde{x}^*}) \cdot \beta
\end{aligned}
\]
Theorem 7.4 If \(\eta(t|\tilde{x}) = \eta_0(t) + \tilde{x}\cdot \tilde{\beta}\), then:
\[
\begin{aligned}
\theta(t|\tilde{x}: {\tilde{x}^*})
&= \text{exp}{\left\{\Delta \eta(t|\tilde{x}: {\tilde{x}^*})\right\}}
\\
&= \text{exp}{\left\{(\tilde{x}- {\tilde{x}^*}) \cdot \beta\right\}}
\end{aligned}
\]
So for proportional hazards models, we can write the hazard ratio using a shorthand notation:
\[\theta(t| \tilde{x}: {\tilde{x}^*}) = \theta(\tilde{x}: {\tilde{x}^*})\]
Lemma 7.3 \[\Delta \eta(t|\tilde{x})= \tilde{x}\cdot \tilde{\beta} \tag{7.7}\]
Theorem 7.5 If \(\eta(t|\tilde{x}) = \eta_0(t) + \tilde{x}\cdot \tilde{\beta}\), then:
\[\theta(t|\tilde{x}) = \text{exp}{\left\{\tilde{x}\cdot \tilde{\beta}\right\}}\]
Proof. \[
\begin{aligned}
\theta(t|\tilde{x})
&\stackrel{\text{def}}{=}\theta(t| \tilde{x}: \tilde{0})
\\
&= \text{exp}{\left\{\Delta \eta(t|\tilde{x})\right\}}
\\
&= \text{exp}{\left\{\tilde{x}\cdot \tilde{\beta}\right\}}
\end{aligned}
\]
Theorem 7.6 \[{\lambda}(t|x) = {\lambda}_0(t)\theta(x)\]
Also:
Theorem 7.7 \[
\begin{aligned}
\theta(x) &= \text{exp}{\left\{\Delta \eta(x)\right\}}
\\
\log{{\lambda}(t|x)}
&= \log{{\lambda}_0(t)} + \Delta \eta(x)
\\
&= \eta_0(t) + \Delta \eta(x)
\\
\Delta \eta(x) &= \tilde{x}\cdot \tilde{\beta}\\
&\stackrel{\text{def}}{=}\beta_1x_1+\cdots+\beta_px_p
\end{aligned}
\]
This model is semi-parametric, because the linear predictor depends on estimated parameters but the base hazard function is unspecified. There is no constant term in \(\eta(x)\), because it is absorbed in the base hazard.
Alternatively, we could define \(\beta_0(t) = \log{{\lambda}_0(t)}\), and then:
\[\eta(x,t) = \beta_0(t) + \beta_1x_1+\cdots+\beta_px_p\]
For two different individuals with covariate patterns \(\tilde{x}_1\) and \(\tilde{x}_2\), the ratio of the hazard functions (a.k.a. hazard ratio, a.k.a. relative hazard) is:
\[
\begin{aligned}
\frac{{\lambda}(t|\tilde{x}_1)}{{\lambda}(t|\tilde{x}_2)}
&=\frac{{\lambda}_0(t)\theta(\tilde{x}_1)}{{\lambda}_0(t)\theta(\tilde{x}_2)}\\
&=\frac{\theta(\tilde{x}_1)}{\theta(\tilde{x}_2)}\\
\end{aligned}
\]
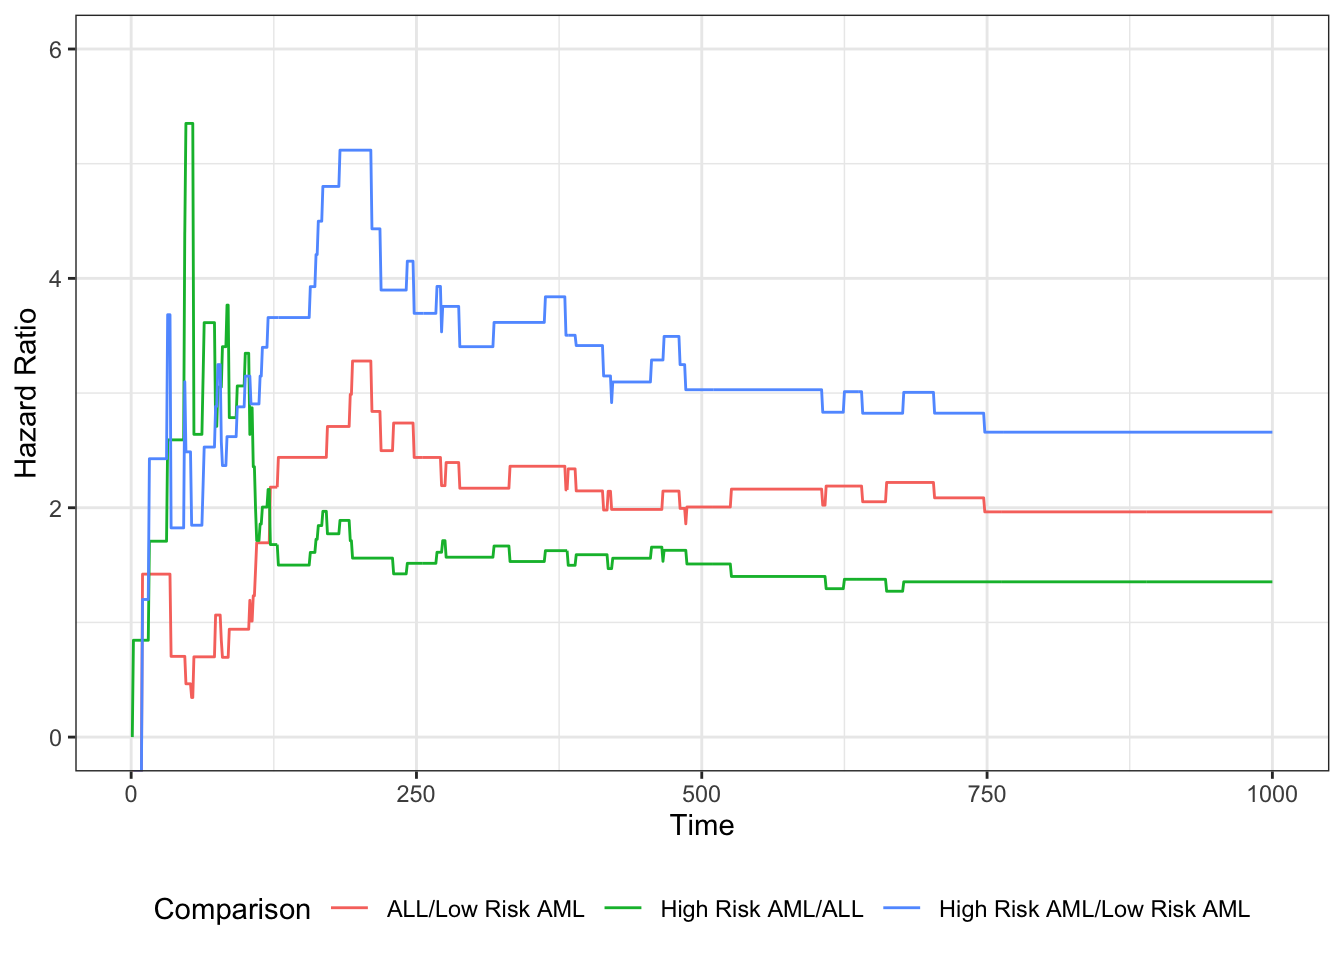
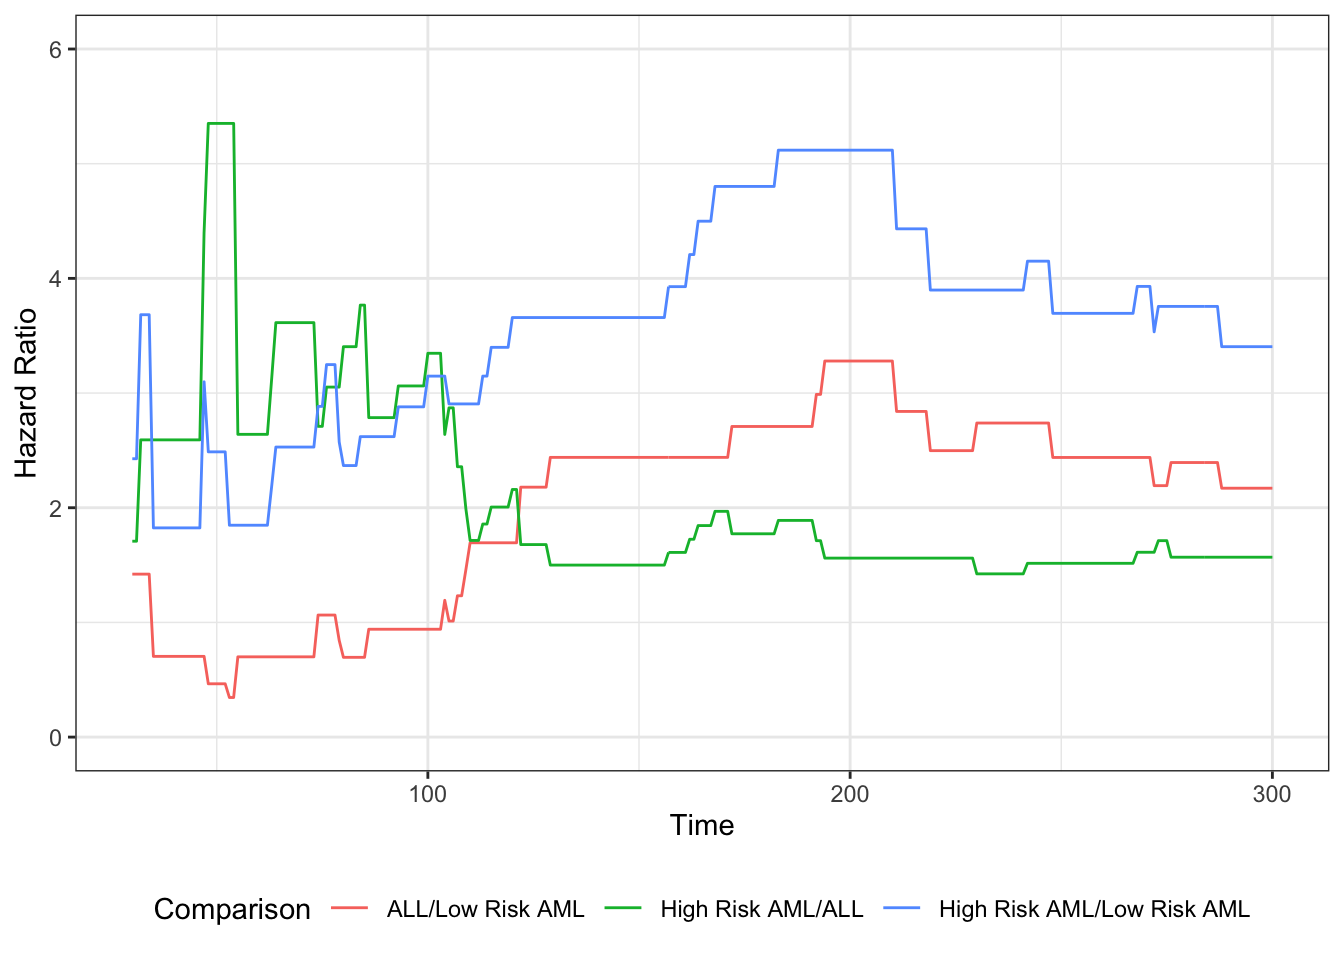
Under the proportional hazards model, this ratio (a.k.a. proportion) does not depend on \(t\). This property is a structural limitation of the model; it is called the proportional hazards assumption.
Definition 7.12 (proportional hazards) A conditional probability distribution \(p(T|X)\) has proportional hazards if the hazard ratio \({\lambda}(t|\tilde{x}_1)/{\lambda}(t|\tilde{x}_2)\) does not depend on \(t\). Mathematically, it can be written as:
\[
\frac{{\lambda}(t|\tilde{x}_1)}{{\lambda}(t|\tilde{x}_2)}
= \theta(\tilde{x}_1,\tilde{x}_2)
\]
As we saw above, Cox’s proportional hazards model has this property, with \(\theta(\tilde{x}_1,\tilde{x}_2) = \frac{\theta(\tilde{x}_1)}{\theta(\tilde{x}_2)}\).
Theorem 7.8
We are using two similar notations, \(\theta(\tilde{x},{\tilde{x}^*})\) and \(\theta(\tilde{x})\). We can link these notations: \[\theta(\tilde{x}) \stackrel{\text{def}}{=}\theta(\tilde{x}, \tilde{0})\]
Then:
\[\theta(\tilde{x}, {\tilde{x}^*}) = \frac{\theta(\tilde{x})}{\theta({\tilde{x}^*})}\] \[\theta(\tilde{0}) = \theta(\tilde{0}, \tilde{0}) = 1\]
The proportional hazards model also has additional notable properties:
\[
\begin{aligned}
\frac{{\lambda}(t|\tilde{x}_1)}{{\lambda}(t|\tilde{x}_2)}
&=\frac{\theta(\tilde{x}_1)}{\theta(\tilde{x}_2)}\\
&=\frac{\text{exp}{\left\{\eta(\tilde{x}_1)\right\}}}{\text{exp}{\left\{\eta(\tilde{x}_2)\right\}}}\\
&=\text{exp}{\left\{\eta(\tilde{x}_1)-\eta(\tilde{x}_2)\right\}}\\
&=\text{exp}{\left\{\tilde{x}_1'\beta-\tilde{x}_2'\beta\right\}}\\
&=\text{exp}{\left\{(\tilde{x}_1 - \tilde{x}_2)'\beta\right\}}\\
\end{aligned}
\]
Hence on the log scale, we have:
Theorem 7.9 \[
\begin{aligned}
\log{\frac{{\lambda}(t|\tilde{x})}{{\lambda}(t|{\tilde{x}^*})}}
&= \Delta \eta(t|\tilde{x}: {\tilde{x}^*})
\\
&\stackrel{\text{def}}{=}\eta(t|\tilde{x}) - \eta(t|{\tilde{x}^*})
\\
&=\eta(\tilde{x}_1)-\eta(\tilde{x}_2)\\
&= \tilde{x}_1'\beta-\tilde{x}_2'\beta\\
&= (\tilde{x}_1 - \tilde{x}_2)'\beta
\end{aligned}
\]
If only one covariate \(x_j\) is changing, then:
\[
\begin{aligned}
\log{\frac{{\lambda}(t|\tilde{x}_1)}{{\lambda}(t|\tilde{x}_2)}}
&= (x_{1j} - x_{2j}) \cdot \beta_j\\
&\propto (x_{1j} - x_{2j})
\end{aligned}
\]
That is, under Cox’s model \({\lambda}(t|\tilde{x}) = {\lambda}_0(t)\text{exp}{\left\{\tilde{x}'\beta\right\}}\), the log of the hazard ratio is proportional to the difference in \(x_j\), with the proportionality coefficient equal to \(\beta_j\).
Further,
\[
\begin{aligned}
\log{{\lambda}(t|\tilde{x})}
&=\log{{\lambda}_0(t)} + x'\beta
\end{aligned}
\]
Additional properties of the proportional hazards model
If \({\lambda}(t|x)= {\lambda}_0(t)\theta(x)\), then:
Theorem 7.10 (Cumulative hazards are also proportional to \({\Lambda}_0(t)\)) \[
\begin{aligned}
{\Lambda}(t|x)
&\stackrel{\text{def}}{=}\int_{u=0}^t {\lambda}(u)du\\
&= \int_{u=0}^t {\lambda}_0(u)\theta(x)du\\
&= \theta(x)\int_{u=0}^t {\lambda}_0(u)du\\
&= \theta(x){\Lambda}_0(t)
\end{aligned}
\]
where \({\Lambda}_0(t) \stackrel{\text{def}}{=}{\Lambda}(t|0) = \int_{u=0}^t {\lambda}_0(u)du\).
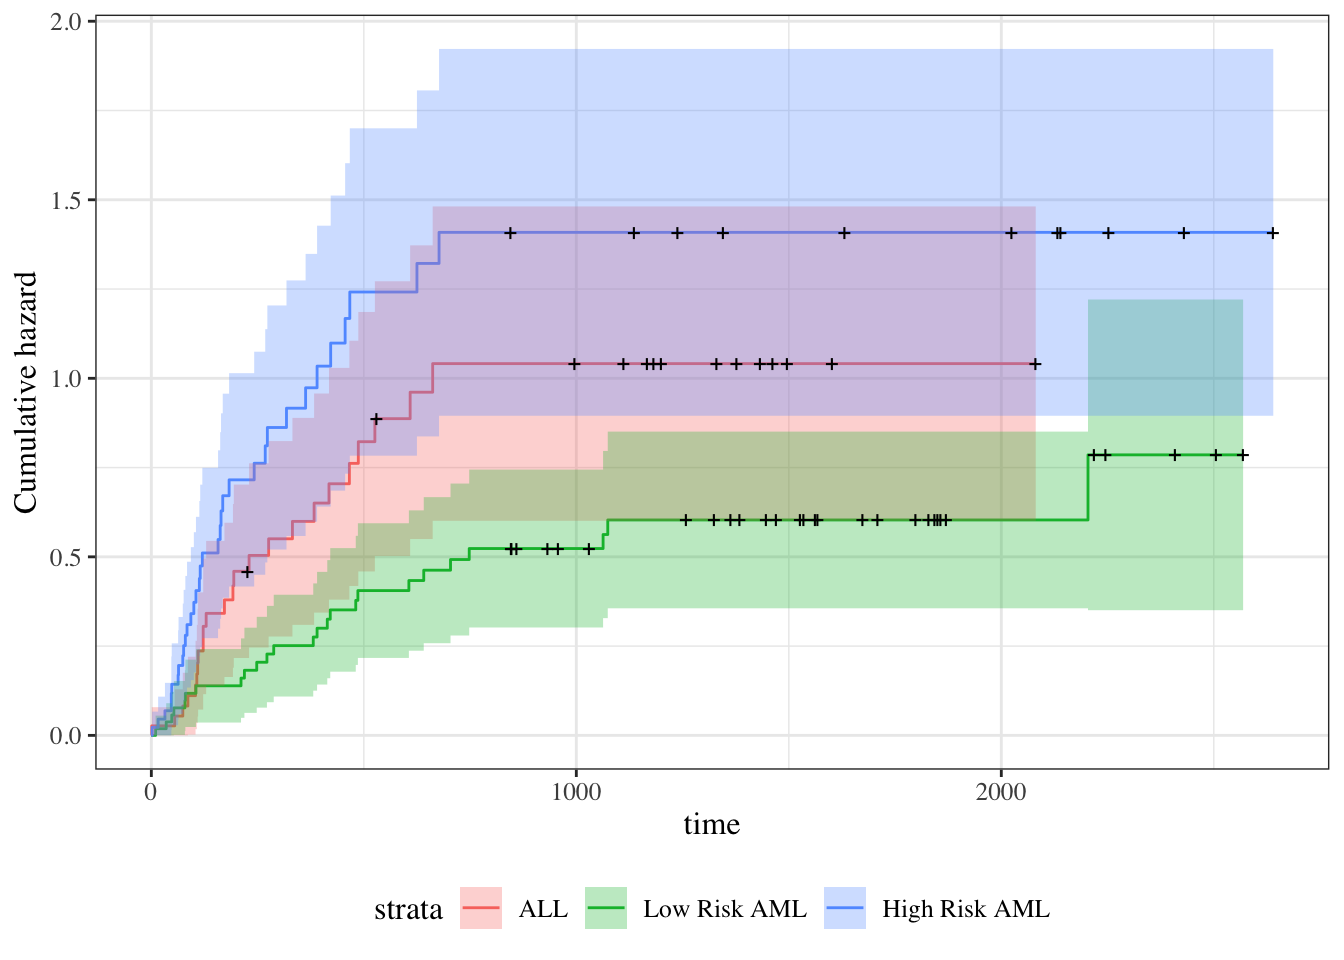
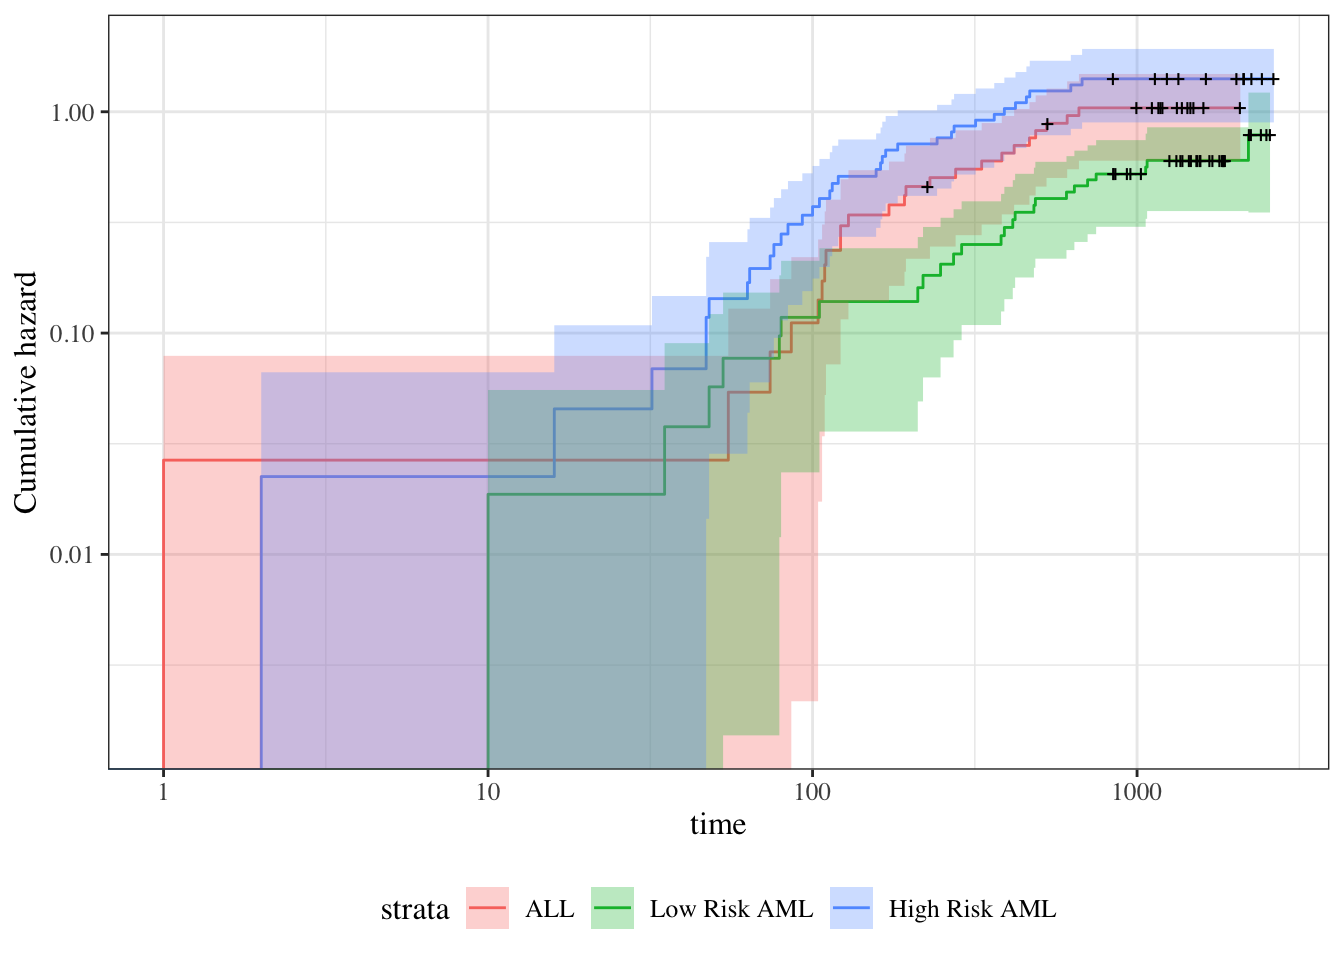
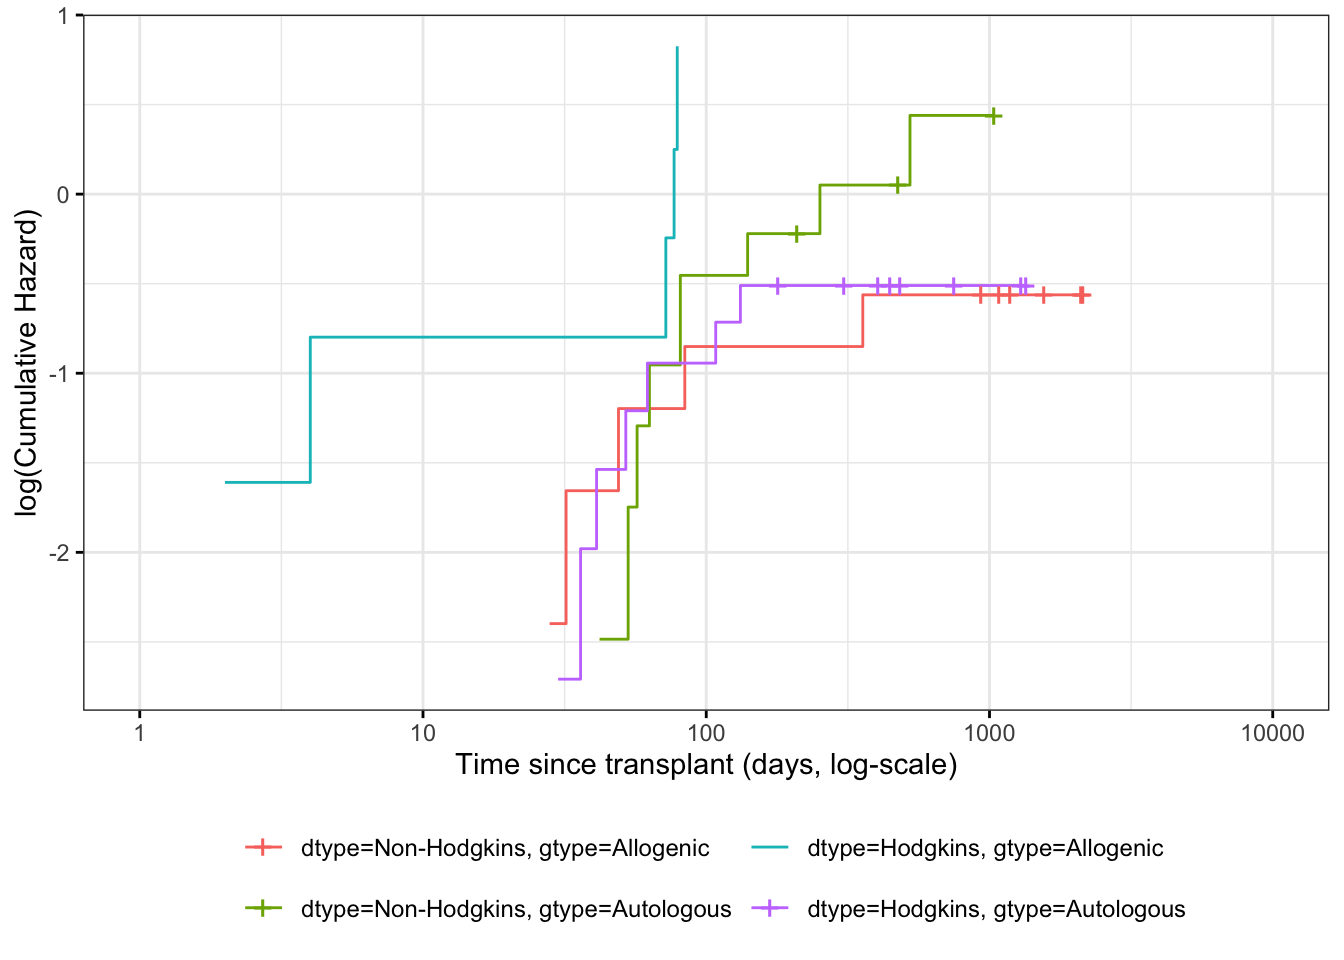
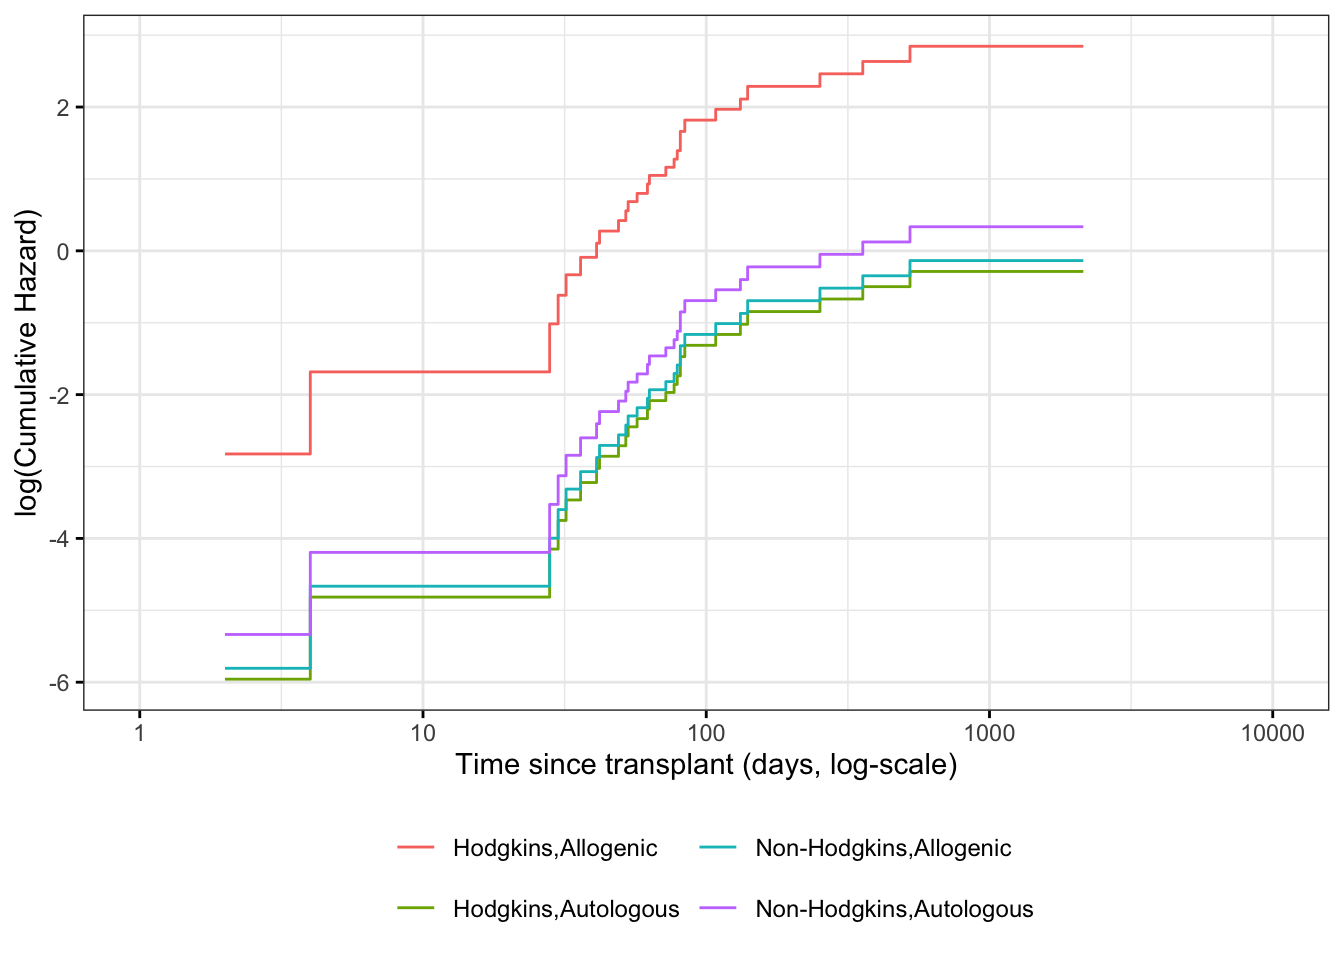
Theorem 7.11 (The logarithms of cumulative hazard should be parallel) \[
\text{log}{\left\{{\Lambda}(t|\tilde{x})\right\}} =\text{log}{\left\{{\Lambda}_0(t)\right\}} + \tilde{x}\cdot \tilde{\beta}
\]
Corollary 7.4 (linear model for log-negative-log survival) \[
\text{log}{\left\{-\text{log}{\left\{\text{S}(t|\tilde{x})\right\}}\right\}} =
\text{log}{\left\{-\text{log}{\left\{\text{S}_0(t)\right\}}\right\}} + \tilde{x}\cdot \tilde{\beta}
\]
Theorem 7.12 (Survival functions are exponential multiples of \(\text{S}_0(t)\)) \[\text{S}(t|x) = {\left[\text{S}_0(t)\right]}^{\theta(x)}\]
Proof. \[
\begin{aligned}
\text{S}(t|x)
&= \text{exp}{\left\{-{\Lambda}(t|x)\right\}}\\
&= \text{exp}{\left\{-\theta(x)\cdot {\Lambda}_0(t)\right\}}\\
&= {\left(\text{exp}{\left\{- {\Lambda}_0(t)\right\}}\right)}^{\theta(x)}\\
&= {\left[\text{S}_0(t)\right]}^{\theta(x)}\\
\end{aligned}
\]
Summary of proportional hazards model structure and assumptions
Joint likelihood of data set: \(\mathscr{L}\stackrel{\text{def}}{=}\text{p}(\tilde{Y}= \tilde{y}, \tilde{D}= \tilde{d}| \mathbf{X}= \mathbf{x})\)
Marginal likelihood contribution of obs. i : \(\mathscr{L}_i \stackrel{\text{def}}{=}\text{p}(Y_i= y_i, D_i = d_i | \tilde{X}_i = \tilde{x}_i)\)
Independent Observations Assumption: \(\mathscr{L}= \prod_{i=1}^n \mathscr{L}_i\)
Non-Informative Censoring Assumption: \(T_i\perp\!\!\!\perp C_i | \tilde{X}_i\)
\[
\mathscr{L}_i \propto [\text{f}_T(y_i|\tilde{x}_i)]^{d_i} [\text{S}_T(y_i | \tilde{x}_i)]^{1-d_i}
= \text{S}_T(y_i|\tilde{x}_i) \cdot [{\lambda}_T(y_i|\tilde{x}_i)]^{d_i}
\]
Survival function: \(\text{S}(t | \tilde{x}) \stackrel{\text{def}}{=}\text{P}(T > t|\tilde{X}= \tilde{x}) = \int_{u=t}^{\infty} \text{f}(u|\tilde{x})du = \text{exp}{\left\{-{\Lambda}(t|\tilde{x})\right\}}\)
Probability density function: \(\text{f}(t| \tilde{x}) \stackrel{\text{def}}{=}\text{p}(T=t|\tilde{X}= \tilde{x}) = -\text{S}'(t|\tilde{x}) = {\lambda}(t| \tilde{x}) \text{S}(t | \tilde{x})\)
Cumulative hazard function: \({\Lambda}(t | \tilde{x}) \stackrel{\text{def}}{=}\int_{u=0}^t {\lambda}(u|\tilde{x})du = -\text{log}{\left\{\text{S}(t|\tilde{x})\right\}}\)
Hazard function: \({\lambda}(t |\tilde{x}) \stackrel{\text{def}}{=}\text{p}(T=t|T\ge t,\tilde{X}= \tilde{x}) = {\Lambda}'(t|\tilde{x}) = \frac{\text{f}(t|\tilde{x})}{\text{S}(t|\tilde{x})}\)
Hazard ratio: \(\theta(t| \tilde{x}: {\tilde{x}^*}) \stackrel{\text{def}}{=}\frac{{\lambda}(t|\tilde{x})}{{\lambda}(t|{\tilde{x}^*})}\)
Log-Hazard function: \(\eta(t|\tilde{x}) \stackrel{\text{def}}{=}\text{log}{\left\{\lambda(t|\tilde{x})\right\}} = \eta_0(t) + \Delta \eta(t|\tilde{x})\)
Proportional Hazards Assumption:
\[
\begin{aligned}
{\lambda}(t |\tilde{x}) &= {\lambda}_0(t) \cdot \theta(\tilde{x})
\\
{\Lambda}(t |\tilde{x}) &= {\Lambda}_0(t) \cdot \theta(\tilde{x})
\\
\eta(t|\tilde{x}) &= \eta_0(t) + \Delta \eta(\tilde{x})
\end{aligned}
\]
Logarithmic Link Function Assumption:
Link function: \[\text{log}{\left\{{\lambda}(t|\tilde{x})\right\}} = \eta(t|\tilde{x})\] \[\text{log}{\left\{\theta(\tilde{x})\right\}} = \Delta \eta(\tilde{x})\]
Inverse link function: \[{\lambda}(t|\tilde{x}) = \text{exp}{\left\{\eta(t|\tilde{x})\right\}}\] \[\theta(\tilde{x}) = \text{exp}{\left\{\Delta \eta(\tilde{x})\right\}}\]
Linear Predictor Component:
\[\eta(t|\tilde{x}) = \eta_0(t) + \Delta \eta(t|\tilde{x})\] \[\Delta \eta(t|\tilde{x}) = \tilde{x}\cdot \tilde{\beta}\]
Linear Predictor Component Functional Form Assumption:
\[\Delta \eta(t|\tilde{x}) = \tilde{x}\cdot \tilde{\beta}\stackrel{\text{def}}{=}\beta_1 x_1 + \cdots + \beta_p x_p\]
Fitting proportional hazards models to data
How do we fit a proportional hazards regression model? We need to estimate the coefficients of the covariates, and we need to estimate the base hazard \({\lambda}_0(t)\). For the covariates, supposing for simplicity that there are no tied event times, let the event times for the whole data set be \(t_1, t_2,\ldots,t_D\). Let the risk set at time \(t_i\) be \(R(t_i)\) and
\[
\begin{aligned}
\eta(\tilde{x}) &= \beta_1x_{1}+\cdots+\beta_p x_{p}\\
\theta(\tilde{x}) &= e^{\eta(\tilde{x})}\\
{\lambda}(t|X=x)&= {\lambda}_0(t)e^{\eta(\tilde{x})}=\theta(\tilde{x}) {\lambda}_0(t)
\end{aligned}
\]
Conditional on a single failure at time \(t\), the probability that the event is due to subject \(f\in R(t)\) is approximately
\[
\begin{aligned}
\Pr(f \text{ fails}|\text{1 failure at } t)
&= \frac{{\lambda}_0(t)e^{\eta(\tilde{x}_f)}}{\sum_{k \in R(t)}{\lambda}_0(t)e^{\eta(\tilde{x}_f)}}\\
&=\frac{\theta(\tilde{x}_f)}{\sum_{k \in R(t)} \theta(\tilde{x}_k)}
\end{aligned}
\]
The logic behind this has several steps. We first fix (ex post) the failure times and note that in this discrete context, the probability \(p_j\) that a subject \(j\) in the risk set fails at time \(t\) is just the hazard of that subject at that time.
If all of the \(p_j\) are small, the chance that exactly one subject fails is
\[
\sum_{k\in R(t)}p_k\left[\prod_{m\in R(t), m\ne k} (1-p_m)\right]\approx\sum_{k\in R(t)}p_k
\]
If subject \(i\) is the one who experiences the event of interest at time \(t_i\), then the partial likelihood is
\[
\begin{aligned}
\mathscr{L}^*_i &= \frac{\theta(\tilde{x}_i)}{\sum_{k \in R(t_i)} \theta(\tilde{x}_k)}
\\
\mathscr{L}^* &=
\prod_{{\left\{i:\ d_i = 1\right\}}} \mathscr{L}^*_i
\end{aligned}
\]
and we can numerically maximize this with respect to the coefficients \(\tilde{\beta}\) that specify \(\eta(\tilde{x}) = \tilde{x}'\tilde{\beta}\). When there are tied event times adjustments need to be made, but the likelihood is still similar. Note that we don’t need to know the base hazard to solve for the coefficients.
Once we have coefficient estimates \(\hat{\tilde{\beta}} =(\hat \beta_1,\ldots,\hat\beta_p)\), this also defines \(\hat\eta(x)\) and \(\hat\theta(x)\), and then the estimated base cumulative hazard function is
\[\hat {\Lambda}_0(t) =
\sum_{t_i < t} \frac{d_i}{\sum_{k\in R(t_i)} \theta(x_k)}\]
which reduces to the Nelson-Aalen estimate when there are no covariates. There are numerous other estimates that have been proposed as well.
Adjustment for Ties (optional)
At each time \(t_i\) at which more than one of the subjects has an event, let \(d_i\) be the number of events at that time, \(D_i\) the set of subjects with events at that time, and let \(s_i\) be a covariate vector for an artificial subject obtained by adding up the covariate values for the subjects with an event at time \(t_i\). Let \[\bar\eta_i = \beta_1s_{i1}+\cdots+\beta_ps_{ip}\] and \(\bar\theta_i = \text{exp}{\left\{\bar\eta_i\right\}}\).
Let \(s_i\) be a covariate vector for an artificial subject obtained by adding up the covariate values for the subjects with an event at time \(t_i\). Note that
\[
\begin{aligned}
\bar\eta_i &=\sum_{j \in D_i}\beta_1x_{j1}+\cdots+\beta_px_{jp}\\
&= \beta_1s_{i1}+\cdots+\beta_ps_{ip}\\
\bar\theta_i &= \text{exp}{\left\{\bar\eta_i\right\}}\\
&= \prod_{j \in D_i}\theta_i
\end{aligned}
\]
Breslow’s method for ties
Breslow’s method estimates the partial likelihood as
\[
\begin{aligned}
L(\beta|T) &=
\prod_i \frac{\bar\theta_i}{[\sum_{k \in R(t_i)} \theta_k]^{d_i}}\\
&= \prod_i \prod_{j \in D_i}\frac{\theta_j}{\sum_{k \in R(t_i)} \theta_k}
\end{aligned}
\]
This method is equivalent to treating each event as distinct and using the non-ties formula. It works best when the number of ties is small. It is the default in many statistical packages, including PROC PHREG in SAS.
Efron’s method for ties
The other common method is Efron’s, which is the default in R.
\[L(\beta|T)=
\prod_i \frac{\bar\theta_i}{\prod_{j=1}^{d_i}[\sum_{k \in R(t_i)} \theta_k-\frac{j-1}{d_i}\sum_{k \in D_i} \theta_k]}\] This is closer to the exact discrete partial likelihood when there are many ties.
The third option in R (and an option also in SAS as discrete) is the “exact” method, which is the same one used for matched logistic regression.
Example: Breslow’s method
Suppose as an example we have a time \(t\) where there are 20 individuals at risk and three failures. Let the three individuals have risk parameters \(\theta_1, \theta_2, \theta_3\) and let the sum of the risk parameters of the remaining 17 individuals be \(\theta_R\). Then the factor in the partial likelihood at time \(t\) using Breslow’s method is
\[
\left(\frac{\theta_1}{\theta_R+\theta_1+\theta_2+\theta_3}\right)
\left(\frac{\theta_2}{\theta_R+\theta_1+\theta_2+\theta_3}\right)
\left(\frac{\theta_3}{\theta_R+\theta_1+\theta_2+\theta_3}\right)
\]
If on the other hand, they had died in the order 1,2, 3, then the contribution to the partial likelihood would be:
\[
\left(\frac{\theta_1}{\theta_R+\theta_1+\theta_2+\theta_3}\right)
\left(\frac{\theta_2}{\theta_R+\theta_2+\theta_3}\right)
\left(\frac{\theta_3}{\theta_R+\theta_3}\right)
\]
as the risk set got smaller with each failure. The exact method roughly averages the results for the six possible orderings of the failures.
Example: Efron’s method
But we don’t know the order they failed in, so instead of reducing the denominator by one risk coefficient each time, we reduce it by the same fraction. This is Efron’s method.
\[\left(\frac{\theta_1}{\theta_R+\theta_1+\theta_2+\theta_3}\right)
\left(\frac{\theta_2}{\theta_R+2(\theta_1+\theta_2+\theta_3)/3}\right)
\left(\frac{\theta_3}{\theta_R+(\theta_1+\theta_2+\theta_3)/3}\right)\]
