# Linear (Gaussian) Models
---
{{< include shared-config.qmd >}}
```{r}
include_reference_lines <- FALSE
```
---
:::{.callout-note}
This content is adapted from:
- @dobson4e, Chapters 2-6
- @dunn2018generalized, Chapters 2-3
- @vittinghoff2e, Chapter 4
There are numerous textbooks specifically for linear regression, including:
- @kutner2005applied: used for UCLA Biostatistics MS level linear models class
- @chatterjee2015regression: used for Stanford MS-level linear models class
- @seber2012linear: used for UCLA Biostatistics PhD level linear models class and UC Davis STA 108.
- @kleinbaum2014applied: same first author as @kleinbaum2010logistic and @kleinbaum2012survival
- *Linear Models with R* [@Faraway2025-io]
- *Applied Linear Regression* by Sanford Weisberg [@weisberg2005applied]
For more recommendations, see the discussion on [Reddit](https://www.reddit.com/r/statistics/comments/qwgctl/q_books_on_applied_linear_modelsregression_for/).
- see also <https://web.stanford.edu/class/stats191>
^[the current version of the first regression course I ever took]
:::
## Overview
### Why this course includes linear regression {.smaller}
:::{.fragment .fade-in-then-semi-out}
* This course is about *generalized linear models* (for non-Gaussian outcomes)
:::
:::{.fragment .fade-in-then-semi-out}
* UC Davis STA 108 ("Applied Statistical Methods: Regression Analysis")
is a prerequisite for this course,
so everyone here should have some understanding of linear regression already.
:::
:::{.fragment .fade-in}
* We will review linear regression to:
- make sure everyone is caught up
- provide an epidemiological perspective on model interpretation.
:::
### Chapter overview
* @sec-understand-LMs: how to interpret linear regression models
* @sec-est-LMs: how to estimate linear regression models
* @sec-infer-LMs: how to quantify uncertainty about our estimates
* @sec-diagnose-LMs: how to tell if your model is insufficiently complex
## Understanding Gaussian Linear Regression Models {#sec-understand-LMs}
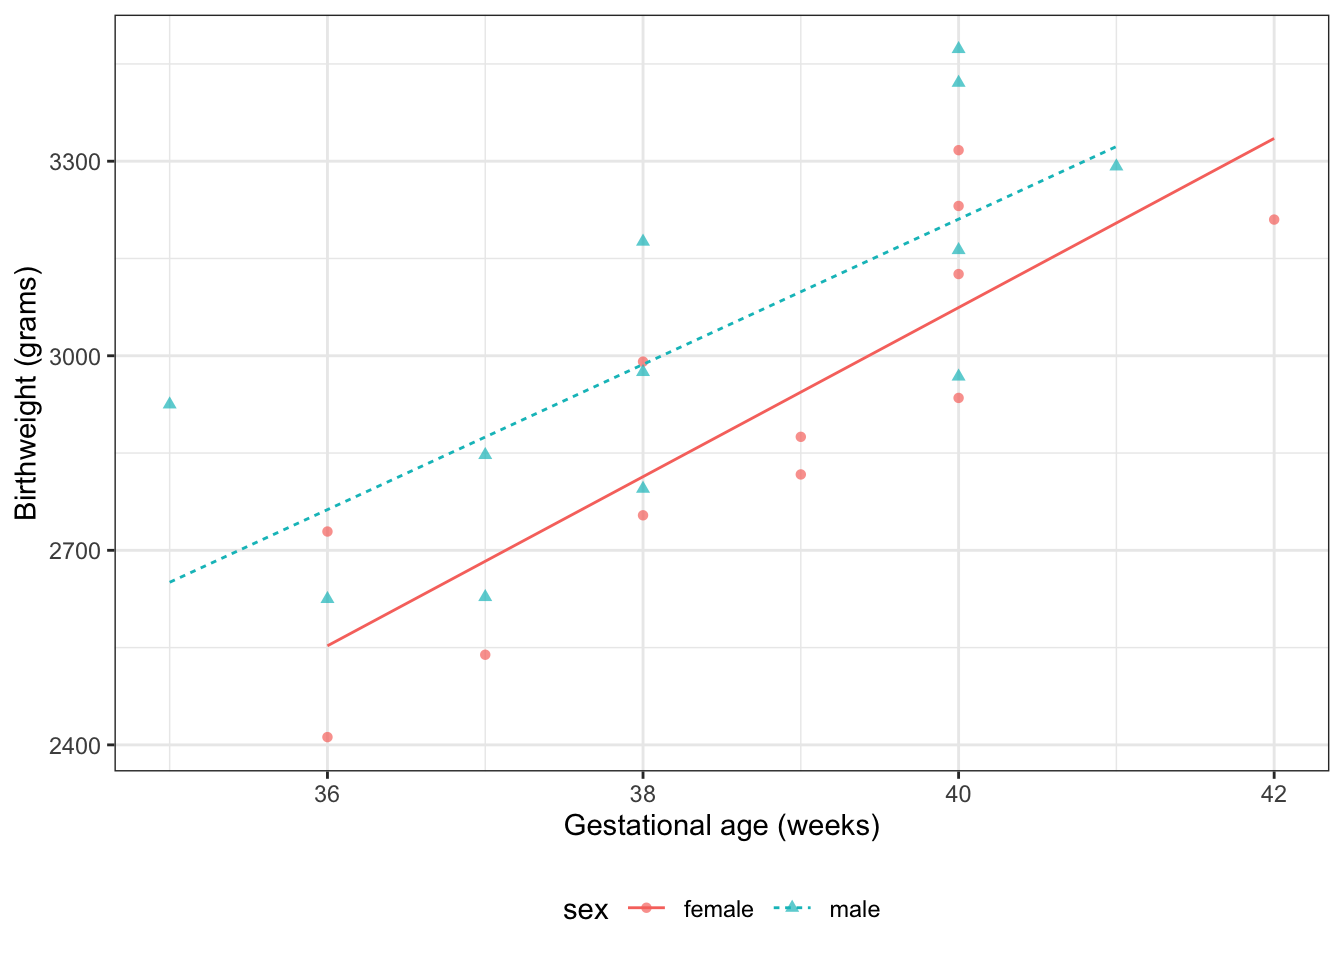
### Motivating example: birthweights and gestational age {.smaller}
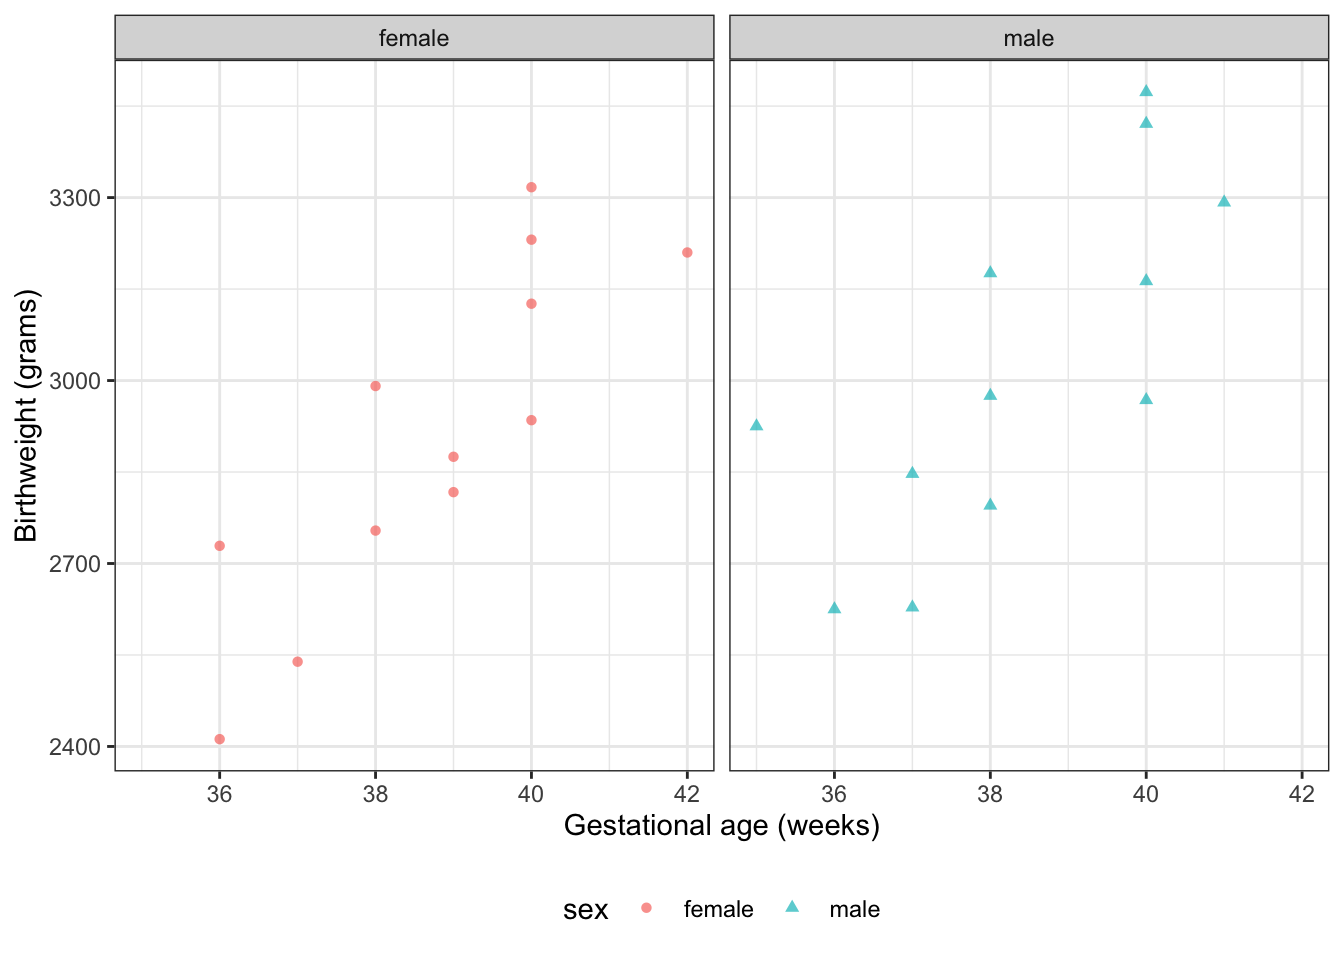
Suppose we want to learn about the distributions of birthweights (*outcome* $Y$)
for (human) babies born at different gestational ages (*covariate* $A$)
and with different chromosomal sexes (*covariate* $S$) (@dobson4e Example 2.2.2).
### Dobson `birthweight` data {.smaller}
::::: {.panel-tabset}
#### Data as table
```{r}
#| label: tbl-birthweight-data1
#| tbl-cap: "`birthweight` data (@dobson4e Example 2.2.2)"
library(dobson)
data("birthweight", package = "dobson")
birthweight
```
#### Reshape data for graphing
```{r}
#| label: tbl-birthweight-data2
#| tbl-cap: "`birthweight` data reshaped"
library(tidyverse)
bw <-
  birthweight |>
  pivot_longer(
    cols = everything(),
    names_to = c("sex", ".value"),
    names_sep = "s "
  ) |>
  rename(age = `gestational age`) |>
  mutate(
    id = row_number(),
    sex = sex |>
      case_match(
        "boy" ~ "male",
        "girl" ~ "female"
      ) |>
      factor(levels = c("female", "male")),
    male = sex == "male",
    female = sex == "female"
  )

bw
```
#### Data as graph
```{r}
#| label: fig-plot-birthweight1
#| fig-cap: "`birthweight` data (@dobson4e Example 2.2.2)"
#| fig-height: 5
#| fig-width: 7
plot1 <- bw |>
  ggplot(aes(
    x = age,
    y = weight,
    shape = sex,
    col = sex
  )) +
  theme_bw() +
  xlab("Gestational age (weeks)") +
  ylab("Birthweight (grams)") +
  theme(legend.position = "bottom") +
  # expand_limits(y = 0, x = 0) +
  geom_point(alpha = .7)
print(plot1 + facet_wrap(~sex))
```
:::::
---
#### Data notation {.smaller}
::: notes
Let's define some notation to represent this data:
:::
- $Y$: birthweight (measured in grams)
- $S$: chromosomal sex: "male" (XY) or "female" (XX)
- $M$: indicator variable for $S$ = "male"^[$M$ is implicitly a deterministic function of $S$]
- $M = 0$ if $S$ = "female"
- $M = 1$ if $S$ = "male"
- $F$: indicator variable for $S$ = "female"^[$F$ is implicitly a deterministic function of $S$]
- $F = 1$ if $S$ = "female"
- $F = 0$ if $S$ = "male"
- $A$: estimated gestational age at birth (measured in weeks).
::: notes
Female is the **reference level** for the categorical variable $S$
(chromosomal sex) and corresponding indicator variable $M$ .
The choice of a reference level is arbitrary and does not limit what
we can do with the resulting model;
it only makes it more computationally convenient to make inferences
about comparisons involving that reference group.
$M$ and $F$ are called **dummy variables**;
together, they are a numeric representation of the categorical variable $S$.
Dummy variables with values 0 and 1 are also called **indicator variables**.
There are other ways to construct dummy variables,
such as using the values -1 and 1
(see @dobson4e §2.4 for details).
:::
### Parallel lines regression {.smaller}
(c.f. @dunn2018generalized
[§2.10.3](https://link.springer.com/chapter/10.1007/978-1-4419-0118-7_2#Sec31))
::: notes
We don't have enough data to model the distribution of birth weight
separately for each combination of gestational age and sex,
so let's instead consider a (relatively) simple model for how that
distribution varies with gestational age and sex:
:::
$$
\ba
Y|M,A &\sciid N(\mu(M,A), \sigma^2)\\
\mu(m,a) &= \beta_0 + \beta_M m + \beta_A a
\ea
$$ {#eq-lm-parallel}
:::{.notes}
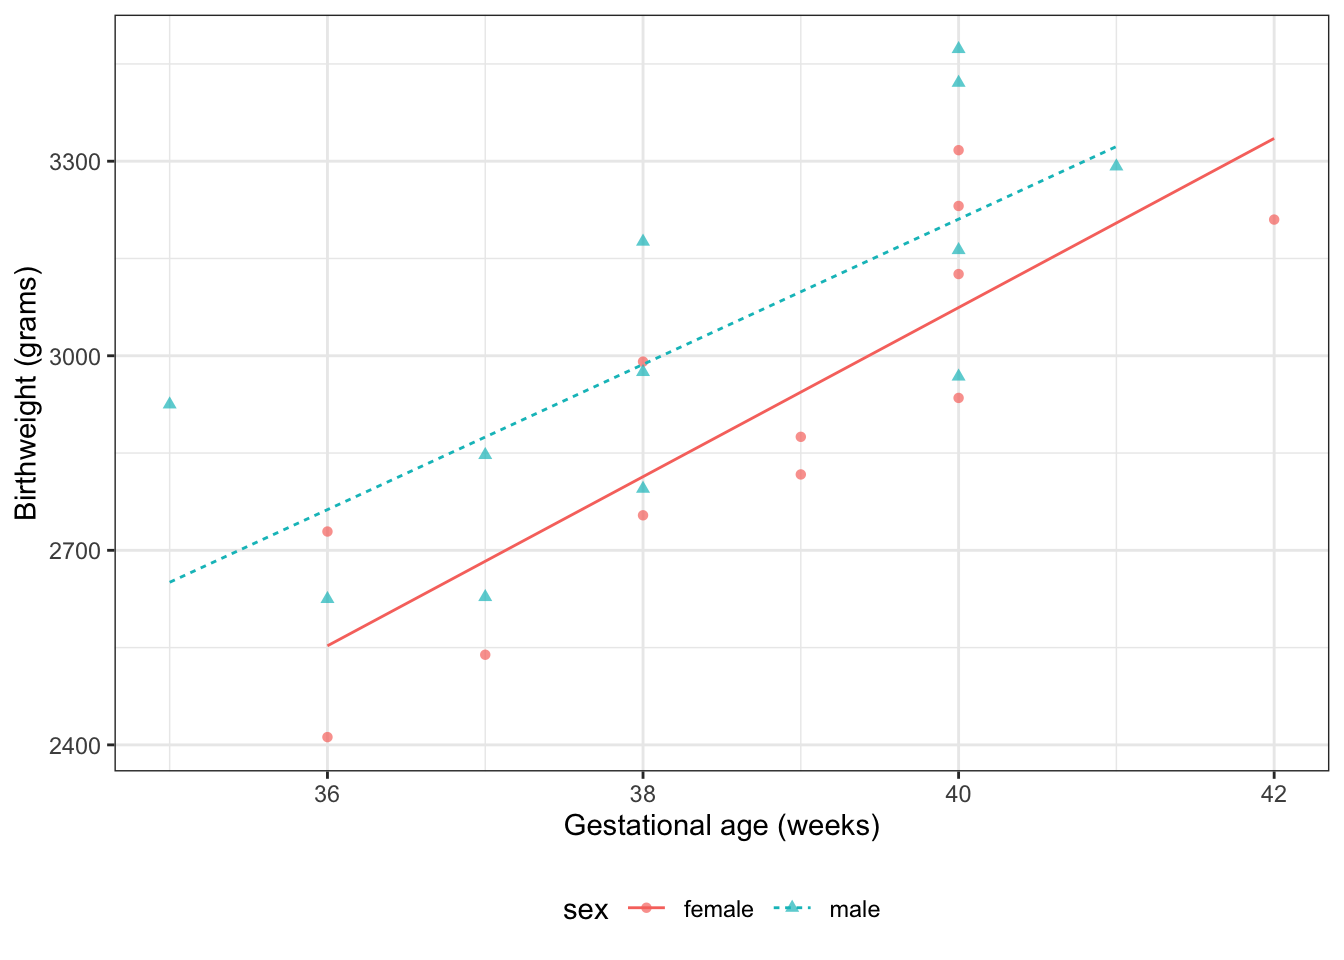
@tbl-lm-parallel shows the parameter estimates from R.
@fig-parallel-fit1 shows the estimated model, superimposed on the data.
:::
::: {.column width=40%}
::: {#tbl-lm-parallel}
```{r}
bw_lm1 <- lm(
  formula = weight ~ sex + age,
  data = bw
)

library(parameters)
bw_lm1 |>
  parameters::parameters() |>
  parameters::print_md(
    include_reference = include_reference_lines,
    select = "{estimate}"
  )
```
Regression parameter estimates for [Model @eq-lm-parallel] of `birthweight` data
:::
:::
:::{.column width=10%}
:::
:::{.column width=50%}
:::{#fig-parallel-fit1}
```{r}
bw <-
  bw |>
  mutate(`E[Y|X=x]` = fitted(bw_lm1)) |>
  arrange(sex, age)

plot2 <-
  plot1 %+% bw +
  geom_line(aes(y = `E[Y|X=x]`))

print(plot2)
```
Graph of [Model @eq-lm-parallel] for `birthweight` data
:::
:::
---
#### Model assumptions and predictions
::: notes
To learn what this model is assuming, let's plug in a few values.
:::
---
::: {#exr-pred-fem-parallel}
What's the mean birthweight for a female born at 36 weeks?
```{r}
#| tbl-cap: "Estimated coefficients for [model @eq-lm-parallel]"
#| code-fold: false
#| echo: false
bw_lm1 |>
parameters::parameters() |>
parameters::print_md(
select = "{estimate}"
)
```
:::
---
:::{.solution .smaller}
\
```{r}
#| tbl-cap: "Estimated coefficients for [model @eq-lm-parallel]"
#| code-fold: false
#| echo: false
bw_lm1 |>
parameters::parameters() |>
parameters::print_md(
select = "{estimate}"
)
```
```{r}
pred_female <- coef(bw_lm1)["(Intercept)"] + coef(bw_lm1)["age"] * 36
### or using built-in prediction:
pred_female_alt <- predict(bw_lm1, newdata = tibble(sex = "female", age = 36))
```
$$
\ba
E[Y|M = 0, A = 36]
&= \beta_0 + \paren{\beta_M \cdot 0}+ \paren{\beta_A \cdot 36} \\
&= `r coef(bw_lm1)["(Intercept)"]` + \paren{`r coef(bw_lm1)["sexmale"]` \cdot 0}
+ \paren{`r coef(bw_lm1)["age"]` \cdot 36} \\
&= `r pred_female`
\ea
$$
:::
---
:::{#exr-pred-male-parallel}
What's the mean birthweight for a male born at 36 weeks?
```{r}
#| tbl-cap: "Estimated coefficients for [model @eq-lm-parallel]"
#| code-fold: false
#| echo: false
bw_lm1 |>
parameters::parameters() |>
parameters::print_md(
select = "{estimate}"
)
```
:::
---
:::{.solution}
\
```{r}
#| tbl-cap: "Estimated coefficients for [model @eq-lm-parallel]"
#| code-fold: false
#| echo: false
bw_lm1 |>
parameters::parameters() |>
parameters::print_md(
select = "{estimate}"
)
```
```{r}
pred_male <-
  coef(bw_lm1)["(Intercept)"] +
  coef(bw_lm1)["sexmale"] +
  coef(bw_lm1)["age"] * 36
```
$$
\ba
E[Y|M = 1, A = 36]
&= \beta_0 + \beta_M \cdot 1+ \beta_A \cdot 36 \\
&= `r pred_male`
\ea
$$
:::
---
:::{#exr-diff-sex-parallel-1}
What's the difference in mean birthweights between males born at 36 weeks and females born at 36 weeks?
:::
```{r}
coef(bw_lm1)
```
---
:::{.solution}
$$
\begin{aligned}
& E[Y|M = 1, A = 36] - E[Y|M = 0, A = 36]\\
&=
`r pred_male` - `r pred_female`\\
&=
`r pred_male - pred_female`
\end{aligned}
$$
Shortcut:
$$
\begin{aligned}
& E[Y|M = 1, A = 36] - E[Y|M = 0, A = 36]\\
&= (\beta_0 + \beta_M \cdot 1+ \beta_A \cdot 36) -
(\beta_0 + \beta_M \cdot 0+ \beta_A \cdot 36) \\
&= \beta_M \\
&= `r coef(bw_lm1)["sexmale"]`
\end{aligned}
$$
:::
:::{.notes}
Age cancels out in this difference.
In other words,
according to this model,
the difference between females and males with the same gestational age
is the same for every age.
This characteristic is an assumption of the model
specified by @eq-lm-parallel.
It's hardwired into the parametric model structure,
even before we estimated values for those parameters.
:::
---
#### Coefficient Interpretation
{{< include _sec_linear_coef_interp_no_intxn.qmd >}}
### Interactions {.smaller}
::: notes
What if we don't like that parallel lines assumption?
Then we need to allow an "interaction" between age $A$ and sex $S$:
:::
$$E[Y|S=s,A=a] = \beta_0 + \beta_A a+ \beta_M m + \beta_{AM} (a \cdot m)$$ {#eq-BW-lm-interact}
::: notes
Now, the slope of mean birthweight $E[Y|A,S]$
with respect to gestational age $A$
depends on the value of sex $S$.
:::
::: {.column width=40% .smaller}
```{r}
#| label: tbl-bw-model-coefs-interact
#| tbl-cap: "Birthweight model with interaction term"
bw_lm2 <- lm(weight ~ sex + age + sex:age, data = bw)
bw_lm2 |>
  parameters() |>
  parameters::print_md(
    include_reference = include_reference_lines,
    select = "{estimate}"
  )
```
:::
:::{.column width=5%}
:::
:::{.column width=55%}
```{r}
#| label: fig-bw-interaction
#| fig-cap: "Birthweight model with interaction term"
bw <-
  bw |>
  mutate(
    predlm2 = predict(bw_lm2)
  ) |>
  arrange(sex, age)

plot1_interact <-
  plot1 %+% bw +
  geom_line(aes(y = predlm2))

print(plot1_interact)
```
:::
::: {.notes}
Now we can see that the lines aren't parallel.
:::
---
Here's another way we could rewrite this model (by collecting terms involving $S$):
$$
E[Y|M,A] = \beta_0 + \beta_M M+ (\beta_A + \beta_{AM} M) A
$$
::: notes
If you want to understand a coefficient in a model with interactions,
collect terms for the corresponding variable,
and you will see which other covariates interact with the variable
whose coefficient you are interested in.
In this case,
the association between
$A$ (age) varies between males and females (that is, by sex $S$).
^[some call this kind of variation "interaction" or "effect modification",
but "act", "effect", "modify", and "by" all suggest causality,
which we are not prepared to assess here;
let's try to avoid using causal terms,
unless we are constructing a causal model.]
So the slope of $Y$ with respect to $A$ depends on the value of $M$.
According to this model, there is no such thing as
"*the* slope of birthweight with respect to age".
There are two slopes, one for each sex.
We can only talk about
"the slope of birthweight with respect to age among males"
and "the slope of birthweight with respect to age among females".
Then:
each non-interaction slope coefficient is the difference in means
per unit difference in its corresponding variable,
when all interacting variables are set to 0.
:::
---
::: notes
To learn what this model is assuming, let's plug in a few values.
:::
:::{#exr-pred-fem-interact}
According to this model, what's the mean birthweight for a female born at 36 weeks?
:::
```{r}
#| code-fold: false
#| echo: false
bw_lm2 |>
parameters() |>
print_md(
include_reference = include_reference_lines,
select = "{estimate}"
)
```
---
::: {.solution}
\
```{r}
#| code-fold: false
#| echo: false
bw_lm2 |>
parameters() |>
print_md(
include_reference = include_reference_lines,
select = "{estimate}"
)
```
```{r}
pred_female <- coef(bw_lm2)["(Intercept)"] + coef(bw_lm2)["age"] * 36
```
$$
E[Y|M = 0, A = 36] =
\beta_0 + \beta_M \cdot 0+ \beta_A \cdot 36 + \beta_{AM} \cdot (0 * 36)
= `r pred_female`
$$
:::
---
:::{#exr-pred-interact-male_36}
What's the mean birthweight for a male born at 36 weeks?
```{r}
#| code-fold: false
#| echo: false
bw_lm2 |>
parameters() |>
print_md(
include_reference = include_reference_lines,
select = "{estimate}"
)
```
:::
---
::: solution
\
```{r}
#| code-fold: false
#| echo: false
bw_lm2 |>
parameters() |>
print_md(
include_reference = include_reference_lines,
select = "{estimate}"
)
```
```{r}
pred_male <-
  coef(bw_lm2)["(Intercept)"] +
  coef(bw_lm2)["sexmale"] +
  coef(bw_lm2)["age"] * 36 +
  coef(bw_lm2)["sexmale:age"] * 36
```
$$
\ba
E[Y|M = 1, A = 36]
&= \beta_0 + \beta_M \cdot 1+ \beta_A \cdot 36 + \beta_{AM} \cdot 1 \cdot 36\\
&= `r pred_male`
\ea
$$
:::
---
:::{#exr-diff-gender-interact}
What's the difference in mean birthweights between males born at 36 weeks and females born at 36 weeks?
:::
---
:::{.solution}
$$
\begin{aligned}
& E[Y|M = 1, A = 36] - E[Y|M = 0, A = 36]\\
&= (\beta_0 + \beta_M \cdot 1+ \beta_A \cdot 36 + \beta_{AM} \cdot 1 \cdot 36)\\
&\ \ \ \ \ -(\beta_0 + \beta_M \cdot 0+ \beta_A \cdot 36 + \beta_{AM} \cdot 0 \cdot 36) \\
&= \beta_M + \beta_{AM}\cdot 36\\
&= `r pred_male - pred_female`
\end{aligned}
$$
:::
:::{.notes}
Note that age now does show up in the difference: in other words, according to this model, the difference in mean birthweights between females and males with the same gestational age can vary by gestational age.
That's how the lines in the graph ended up non-parallel.
:::
---
#### Coefficient Interpretation
{{< include _sec_linear_coef_interp_intxn.qmd >}}
---
#### Compare coefficient interpretations
:::{#tbl-compare-coef-interps}
$\mu(m,a)$ | $\beta_0 + \beta_M m + \beta_A a$ | $\beta_0 + \beta_M m + \beta_A a + \red{\beta_{AM} ma}$
----------------|------------------------------------|---------------------------------------------------
$\beta_0$ | $\mu(0,0)$ | $\mu(0,0)$
$\beta_A$ | $\deriv{a}\mu(\blue{m},a)$ | $\deriv{a}\mu(\red{0},a)$
$\beta_M$ | $\mu(1, \blue{a}) - \mu(0, \blue{a})$ | $\mu(1, \red{0}) - \mu(0,\red{0})$
$\beta_{AM}$ | | $\deriv{a}\mu(1,a) - \deriv{a}\mu(0,a)$
Coefficient interpretations, by model structure
:::
::: notes
In the model with an interaction term multiplying $A\times M$,
the interpretation of $\b_A$ involves the reference level of $M$,
and interpretation of $\beta_M$ involves the reference level of $A$ (@tbl-compare-coef-interps).
:::
### Stratified regression {.smaller}
:::{.notes}
We could re-write the interaction model as a stratified model, with a slope and intercept for each sex:
:::
$$
\E{Y|A=a, S=s} =
\beta_M m + \beta_{AM} (a \cdot m) +
\beta_F f + \beta_{AF} (a \cdot f)
$$ {#eq-model-strat}
Compare this stratified model (@eq-model-strat) with our interaction model, @eq-BW-lm-interact:
$$
\E{Y|A=a, S=s} =
\beta_0 + \beta_A a + \beta_M m + \beta_{AM} (a \cdot m)
$$
::: notes
In the stratified model, the intercept term $\beta_0$ has been relabeled as $\beta_F$.
:::
::: {.column width=45%}
```{r}
#| label: tbl-bw-model-coefs-interact2
#| tbl-cap: "Birthweight model with interaction term"
bw_lm2 <- lm(weight ~ sex + age + sex:age, data = bw)
bw_lm2 |>
  parameters() |>
  print_md(
    include_reference = include_reference_lines,
    select = "{estimate}"
  )
```
:::
:::{.column width=10%}
:::
:::{.column width=45%}
```{r}
#| label: tbl-bw-model-coefs-strat
#| tbl-cap: "Birthweight model - stratified betas"
bw_lm_strat <-
  bw |>
  lm(
    formula = weight ~ sex + sex:age - 1,
    data = _
  )

bw_lm_strat |>
  parameters() |>
  print_md(
    select = "{estimate}"
  )
```
:::
### Curved-line regression
::: notes
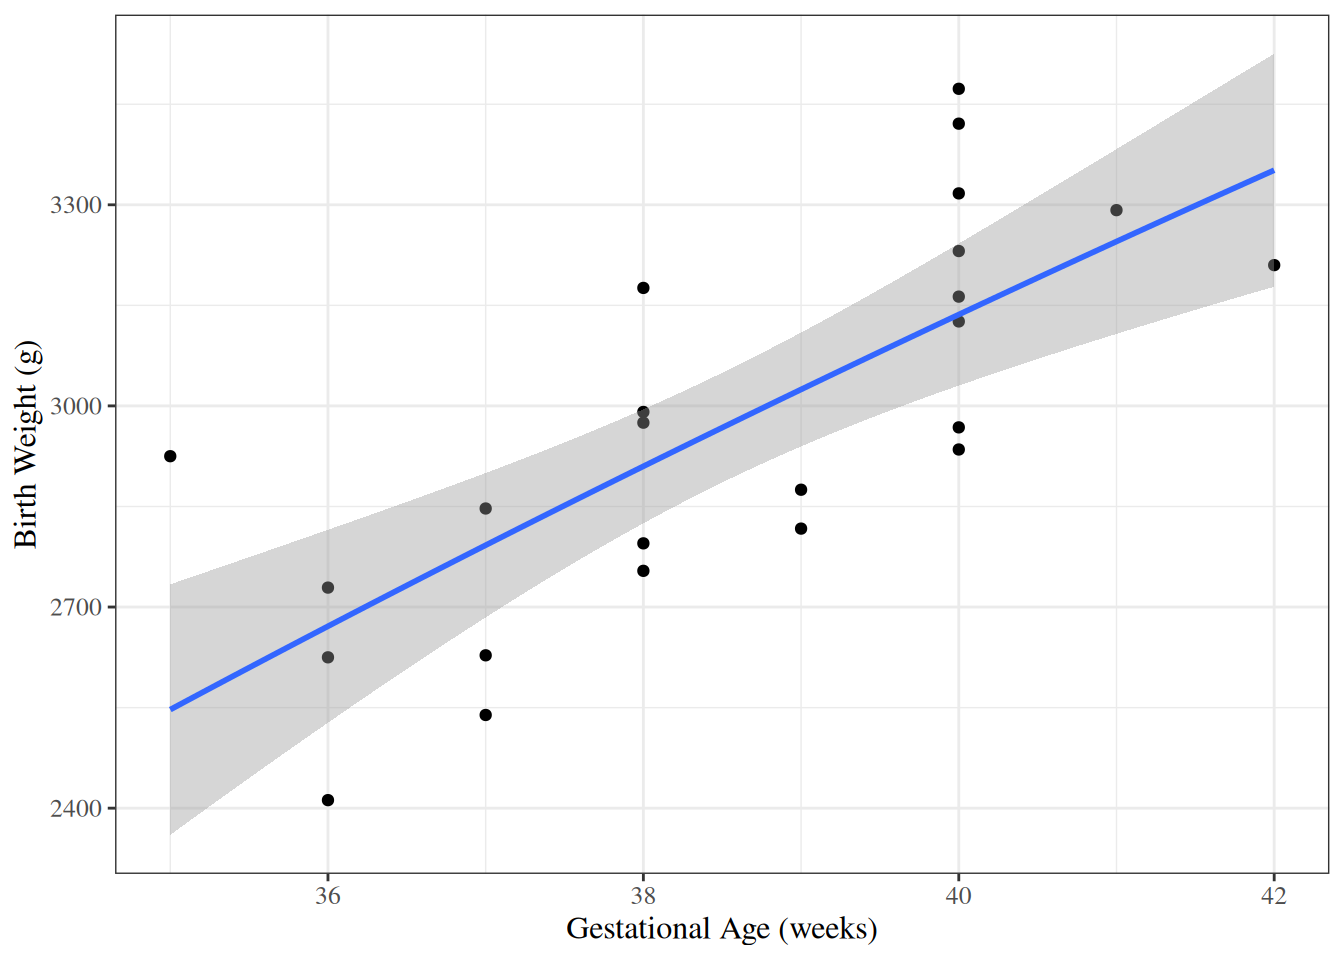
If we transform some of our covariates ($X$s)
and plot the resulting model on the original covariate scale,
we end up with curved regression lines:
:::
```{r}
#| label: fig-birthweight-log-x
#| fig-cap: "`birthweight` model with `age` entering on log scale"
bw_lm3 <- lm(weight ~ sex:log(age) - 1, data = bw)

ggbw <-
  bw |>
  ggplot(
    aes(x = age, y = weight)
  ) +
  geom_point() +
  xlab("Gestational Age (weeks)") +
  ylab("Birth Weight (g)")

ggbw2 <- ggbw +
  stat_smooth(
    method = "lm",
    formula = y ~ log(x),
    geom = "smooth"
  ) +
  xlab("Gestational Age (weeks)") +
  ylab("Birth Weight (g)")


ggbw2 |> print()
```
---
::: notes
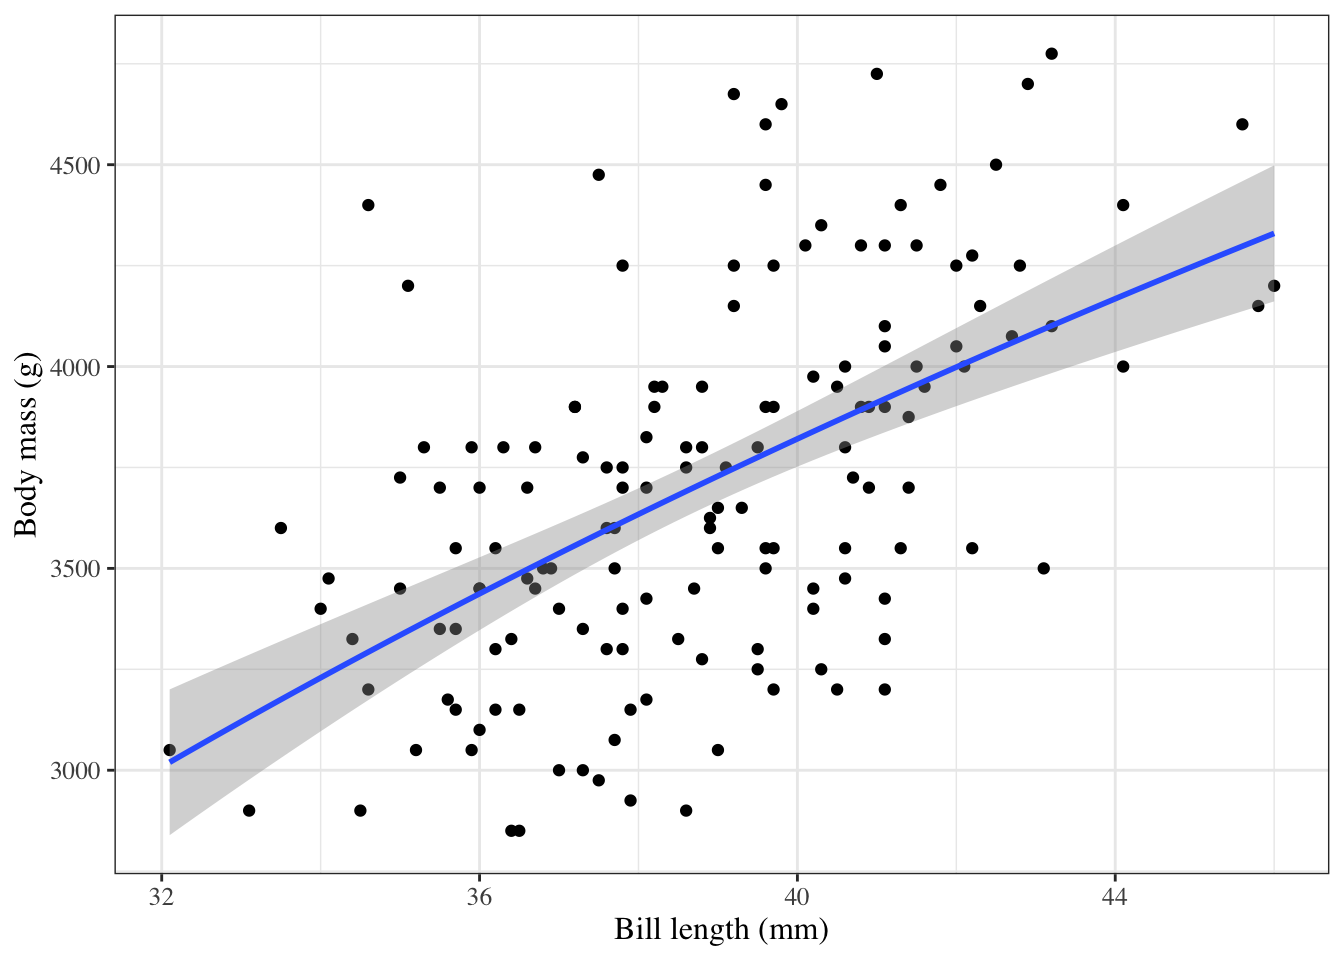
Below is an example with a slightly more obvious curve.
:::
```{r}
#| label: fig-penguins-log-x
#| fig-cap: "`palmerpenguins` model with `bill_length` entering on log scale"
library(palmerpenguins)

ggpenguins <-
  palmerpenguins::penguins |>
  dplyr::filter(species == "Adelie") |>
  ggplot(
    aes(x = bill_length_mm, y = body_mass_g)
  ) +
  geom_point() +
  xlab("Bill length (mm)") +
  ylab("Body mass (g)")

ggpenguins2 <- ggpenguins +
  stat_smooth(
    method = "lm",
    formula = y ~ log(x),
    geom = "smooth"
  ) +
  xlab("Bill length (mm)") +
  ylab("Body mass (g)")


ggpenguins2 |> print()
```
## Estimating Linear Models via Maximum Likelihood {#sec-est-LMs}
{{< include _sec_linreg_mle_est.qmd >}}
---
{{< include _sec_bw_vcov.qmd >}}
## Inference about Gaussian Linear Regression Models {#sec-infer-LMs}
### Motivating example: `birthweight` data
Research question: is there really an interaction between sex and age?
$H_0: \beta_{AM} = 0$
$H_A: \beta_{AM} \neq 0$
$P(|\hat\beta_{AM}| > |`r coef(bw_lm2)["sexmale:age"]`| \mid H_0)$ = ?
### Wald tests and CIs {.smaller}
R can give you Wald tests for single coefficients and corresponding CIs:
```{r "wald tests bw_lm2"}
bw_lm2 |>
  parameters() |>
  print_md(
    include_reference = TRUE
  )
```
To understand what's happening, let's replicate these results by hand for the interaction term.
### P-values {.smaller}
```{r}
bw_lm2 |>
  parameters(keep = "sexmale:age") |>
  print_md(
    include_reference = TRUE
  )
```
```{r}
beta_hat <- coef(summary(bw_lm2))["sexmale:age", "Estimate"]
se_hat <- coef(summary(bw_lm2))["sexmale:age", "Std. Error"]
dfresid <- bw_lm2$df.residual
t_stat <- abs(beta_hat) / se_hat
pval_t <-
  pt(-t_stat, df = dfresid, lower.tail = TRUE) +
  pt(t_stat, df = dfresid, lower.tail = FALSE)
```
$$
\begin{aligned}
&P\paren{
| \hat \beta_{AM} | >
| `r coef(bw_lm2)["sexmale:age"]`| \middle| H_0
}
\\
&= \Pr \paren{
\abs{ \frac{\hat\beta_{AM}}{\hat{SE}(\hat\beta_{AM})} } >
\abs{ \frac{`r beta_hat`}{`r se_hat`} } \middle| H_0
}\\
&= \Pr \paren{
\abs{ T_{`r dfresid`} } > `r t_stat` | H_0
}\\
&= `r pval_t`
\end{aligned}
$$
::: notes
This matches the result in the table above.
:::
### Confidence intervals
```{r}
bw_lm2 |>
  parameters(keep = "sexmale:age") |>
  print_md(
    include_reference = TRUE
  )
```
```{r}
#| label: confint-t
q_t_upper <- qt(
p = 0.975,
df = dfresid,
lower.tail = TRUE
)
q_t_lower <- qt(
p = 0.025,
df = dfresid,
lower.tail = TRUE
)
confint_radius_t <-
se_hat * q_t_upper
confint_t <- beta_hat + c(-1, 1) * confint_radius_t
print(confint_t)
```
::: notes
This also matches.
:::
### Gaussian approximations
Here are the asymptotic (Gaussian approximation) equivalents:
### P-values {.smaller}
```{r}
bw_lm2 |>
  parameters(keep = "sexmale:age") |>
  print_md(
    include_reference = TRUE
  )
```
```{r}
pval_z <- pnorm(abs(t_stat), lower = FALSE) * 2
print(pval_z)
```
### Confidence intervals {.smaller}
```{r}
bw_lm2 |>
  parameters(keep = "sexmale:age") |>
  print_md(
    include_reference = TRUE
  )
```
```{r}
confint_radius_z <- se_hat * qnorm(0.975, lower = TRUE)
confint_z <-
beta_hat + c(-1, 1) * confint_radius_z
print(confint_z)
```
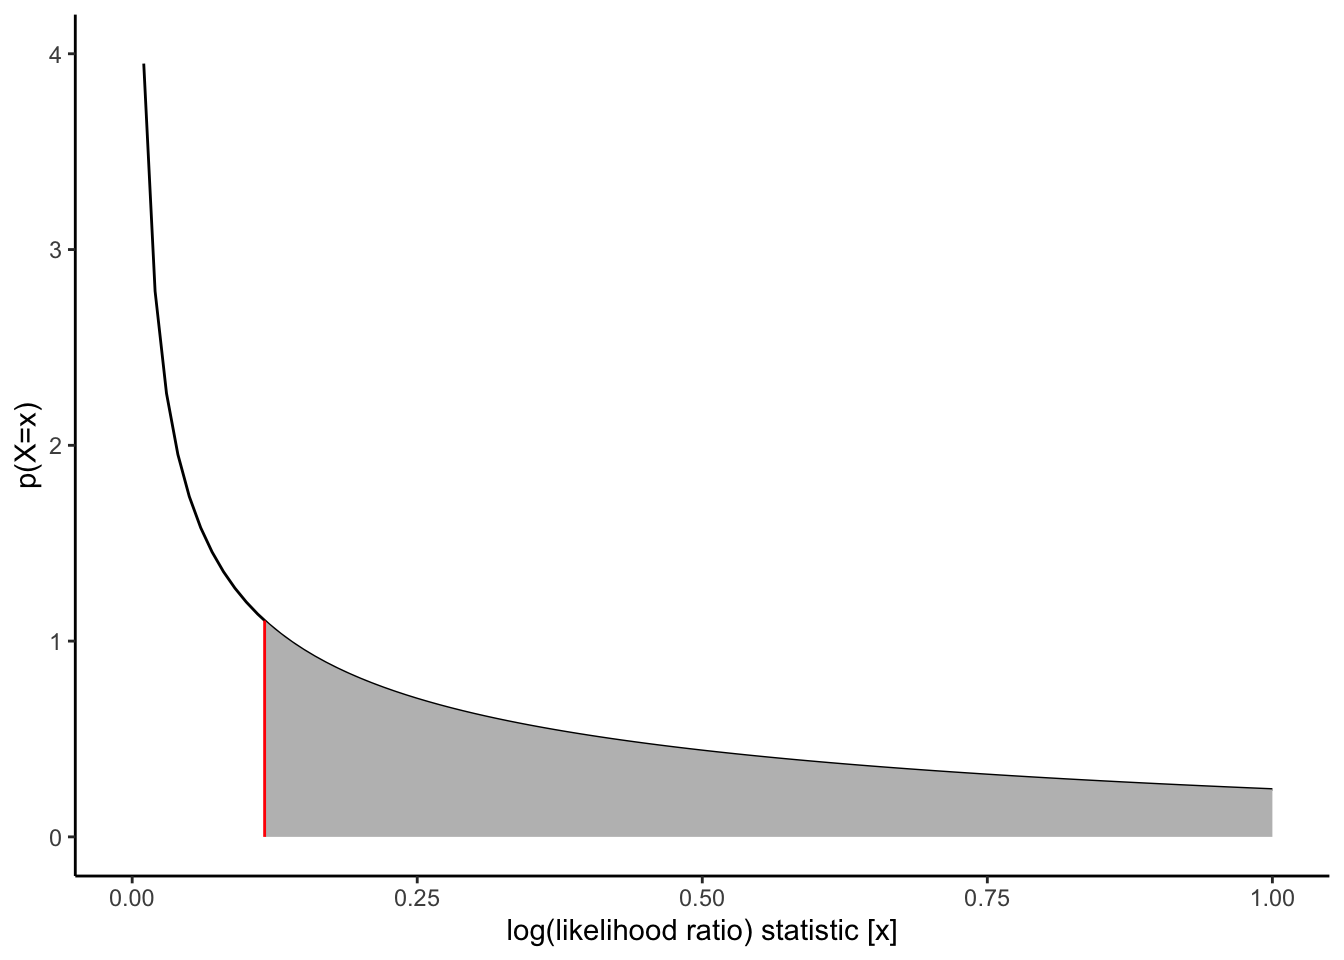
### Likelihood ratio statistics
```{r}
logLik(bw_lm2)
logLik(bw_lm1)
log_LR <- (logLik(bw_lm2) - logLik(bw_lm1)) |> as.numeric()
delta_df <- (bw_lm1$df.residual - df.residual(bw_lm2))
x_max <- 1
```
---
```{r}
#| label: fig-chisq-plot
#| fig-cap: "Chi-square distribution"
d_log_LR <- function(x, df = delta_df) dchisq(x, df = df)

chisq_plot <-
  ggplot() +
  geom_function(fun = d_log_LR) +
  stat_function(
    fun = d_log_LR,
    xlim = c(log_LR, x_max),
    geom = "area",
    fill = "gray"
  ) +
  geom_segment(
    aes(
      x = log_LR,
      xend = log_LR,
      y = 0,
      yend = d_log_LR(log_LR)
    ),
    col = "red"
  ) +
  xlim(0.0001, x_max) +
  ylim(0, 4) +
  ylab("p(X=x)") +
  xlab("log(likelihood ratio) statistic [x]") +
  theme_classic()
chisq_plot |> print()
```
---
Now we can get the p-value:
```{r}
#| label: LRT-pval
pchisq(
q = 2 * log_LR,
df = delta_df,
lower = FALSE
) |>
print()
```
---
In practice you don't have to do this by hand; there are functions to do it for you:
```{r}
# built in
library(lmtest)
lrtest(bw_lm2, bw_lm1)
```
## Goodness of fit
### AIC and BIC
::: notes
When we use likelihood ratio tests, we are comparing how well different models fit the data.
Likelihood ratio tests require "nested" models: one must be a special case of the other.
If we have non-nested models, we can instead use the Akaike Information Criterion (AIC) or Bayesian Information Criterion (BIC):
:::
- AIC = $-2 * \ell(\hat\theta) + 2 * p$
- BIC = $-2 * \ell(\hat\theta) + p * \text{log}(n)$
where $\ell$ is the log-likelihood of the data evaluated using the parameter estimates $\hat\theta$, $p$ is the number of estimated parameters in the model (including $\hat\sigma^2$), and $n$ is the number of observations.
You can calculate these criteria using the `logLik()` function, or use the built-in R functions:
#### AIC in R
```{r}
-2 * logLik(bw_lm2) |> as.numeric() +
2 * (length(coef(bw_lm2)) + 1) # sigma counts as a parameter here
AIC(bw_lm2)
```
#### BIC in R
```{r}
-2 * logLik(bw_lm2) |> as.numeric() +
(length(coef(bw_lm2)) + 1) * log(nobs(bw_lm2))
BIC(bw_lm2)
```
Large values of AIC and BIC are worse than small values.
There are no hypothesis tests or p-values associated with these criteria.
::: notes
To compare models using AIC or BIC,
calculate the criterion for each model and choose the model with the smallest value.
A difference of more than 2 units in AIC is often considered meaningful,
though this is just a rough guideline.
BIC tends to favor simpler models than AIC,
especially when the sample size is large.
:::
### (Residual) Deviance
Let $q$ be the number of distinct covariate combinations in a data set.
```{r}
bw_X_unique <-
  bw |>
  count(sex, age)

n_unique_bw <- nrow(bw_X_unique)
```
For example, in the `birthweight` data,
there are $q = `r n_unique_bw`$ unique patterns (@tbl-bw-x-combos).
::: {#tbl-bw-x-combos}
```{r}
bw_X_unique
```
Unique covariate combinations in the `birthweight` data, with replicate counts
:::
---
::: {#def-replicates}
#### Replicates
If a given covariate pattern has more than one observation in a dataset,
those observations are called **replicates**.
:::
---
::: {#exm-replicate-bw}
#### Replicates in the `birthweight` data
In the `birthweight` dataset, there are 2 replicates of the combination "female, age 36" (@tbl-bw-x-combos).
:::
---
::: {#exr-replicate-bw}
#### Replicates in the `birthweight` data
Which covariate pattern(s) in the `birthweight` data has the most replicates?
:::
---
::: {#sol-replicate-bw}
#### Replicates in the `birthweight` data
Two covariate patterns are tied for most replicates: males at age 40 weeks
and females at age 40 weeks.
40 weeks is the usual length for human pregnancy (@polin2011fetal), so this result makes sense.
```{r}
bw_X_unique |> dplyr::filter(n == max(n))
```
:::
---
#### Saturated models {.smaller}
The most complicated model we could fit would have one parameter (a mean) for each covariate pattern, plus a variance parameter:
```{r}
#| label: tbl-bw-model-sat
#| tbl-cap: "Saturated model for the `birthweight` data"
lm_max <-
  bw |>
  mutate(age = factor(age)) |>
  lm(
    formula = weight ~ sex:age - 1,
    data = _
  )

lm_max |>
  parameters() |>
  print_md()
```
We call this model the **full**, **maximal**, or **saturated** model for this dataset.
---
```{r}
library(rlang) # defines the `.data` pronoun
plot_PIs_and_CIs <- function(model, data) {
  cis <- model |>
    predict(interval = "confidence") |>
    suppressWarnings() |>
    tibble::as_tibble()
  names(cis) <- paste("ci", names(cis), sep = "_")

  preds <- model |>
    predict(interval = "predict") |>
    suppressWarnings() |>
    tibble::as_tibble()
  names(preds) <- paste("pred", names(preds), sep = "_")
  dplyr::bind_cols(bw, cis, preds) |>
    ggplot2::ggplot() +
    ggplot2::aes(
      x = .data$age,
      y = .data$weight,
      col = .data$sex
    ) +
    ggplot2::geom_point() +
    ggplot2::theme(legend.position = "bottom") +
    ggplot2::geom_line(ggplot2::aes(y = .data$ci_fit)) +
    ggplot2::geom_ribbon(
      ggplot2::aes(
        ymin = .data$pred_lwr,
        ymax = .data$pred_upr
      ),
      alpha = 0.2
    ) +
    ggplot2::geom_ribbon(
      ggplot2::aes(
        ymin = .data$ci_lwr,
        ymax = .data$ci_upr
      ),
      alpha = 0.5
    ) +
    ggplot2::facet_wrap(~sex)
}
```
:::{#fig-max-vs-intxn-fits layout-ncol=2}
:::{#fig-fit-intxn}
```{r}
plot_PIs_and_CIs(bw_lm2, bw)
```
Model [-@eq-BW-lm-interact] (linear with age:sex interaction)
:::
:::{#fig-fit-max}
```{r}
plot_PIs_and_CIs(lm_max, bw)
```
Saturated model
:::
Model [-@eq-BW-lm-interact] and saturated model for `birthweight` data,
with confidence and prediction intervals
:::
---
We can calculate the log-likelihood of this model as usual:
```{r}
logLik(lm_max)
```
We can compare this model to our other models using chi-square tests, as usual:
```{r}
lrtest(lm_max, bw_lm2)
```
The likelihood ratio statistic for this test is
$$\lambda = 2 * (\ell_{\text{full}} - \ell) = `r 2 * (logLik(lm_max) - logLik(bw_lm2))`$$
where:
- $\ell_{\text{full}}$ is the log-likelihood of the full model: `r logLik(lm_max)`
- $\ell$ is the log-likelihood of our comparison model (two slopes, two intercepts): `r logLik(bw_lm2)`
This statistic is called the **deviance** or **residual deviance** for our two-slopes and two-intercepts model; it tells us how much the likelihood of that model deviates from the likelihood of the maximal model.
The corresponding p-value tells us whether there we have enough evidence to detect that our two-slopes, two-intercepts model is a worse fit for the data than the maximal model; in other words, it tells us if there's evidence that we missed any important patterns. (Remember, a nonsignificant p-value could mean that we didn't miss anything and a more complicated model is unnecessary, or it could mean we just don't have enough data to tell the difference between these models.)
### Null Deviance
Similarly, the *least* complicated model we could fit would have only one mean parameter, an intercept:
$$\text E[Y|X=x] = \beta_0$$ We can fit this model in R like so:
```{r}
lm0 <- lm(weight ~ 1, data = bw)

lm0 |>
  parameters() |>
  print_md()
```
---
:::{#fig-null-model}
```{r}
lm0 |> plot_PIs_and_CIs()
```
Null model for birthweight data, with 95% confidence and prediction intervals.
:::
---
This model also has a likelihood:
```{r}
logLik(lm0)
```
And we can compare it to more complicated models using a likelihood ratio test:
```{r}
lrtest(bw_lm2, lm0)
```
The likelihood ratio statistic for the test comparing the null model to the maximal model is $$\lambda = 2 * (\ell_{\text{full}} - \ell_{0}) = `r 2 * (logLik(lm_max) - logLik(lm0))`$$ where:
- $\ell_{\text{0}}$ is the log-likelihood of the null model: `r logLik(lm0)`
- $\ell_{\text{full}}$ is the log-likelihood of the maximal model: `r logLik(lm_max)`
In R, this test is:
```{r}
lrtest(lm_max, lm0)
```
This log-likelihood ratio statistic is called the **null deviance**. It tells us whether we have enough data to detect a difference between the null and full models.
## Rescaling
::: notes
Centering covariates (subtracting a constant from them)
can make coefficient interpretations more meaningful,
particularly for the intercept and main effect terms in models with interactions.
:::
### Rescale age {.smaller}
::: notes
For example,
the intercept $\beta_0$ in our interaction model represents
the mean birthweight for females at age = 0 weeks,
which is not a biologically plausible scenario.
If we center age at 36 weeks instead,
$\beta_0$ will represent the mean birthweight for females at 36 weeks,
which is more interpretable.
:::
```{r}
bw <-
  bw |>
  mutate(
    `age - mean` = age - mean(age),
    `age - 36wks` = age - 36
  )

lm1_c <- lm(weight ~ sex + `age - 36wks`, data = bw)

lm2_c <- lm(weight ~ sex + `age - 36wks` + sex:`age - 36wks`, data = bw)

parameters(lm2_c, ci_method = "wald") |> print_md()
```
Compare with what we got without rescaling:
```{r}
parameters(bw_lm2, ci_method = "wald") |> print_md()
```
::: notes
Notice that the slope coefficients (`age - 36wks` and `sexmale:age - 36wks`)
remain the same,
but the intercept and `sexmale` coefficient have changed
to reflect means at age = 36 weeks rather than age = 0 weeks.
:::
## Prediction
### Prediction for linear models
:::{#def-predicted-value}
#### Predicted value
In a regression model $\p(y|\vx)$,
the **predicted value** of $y$ given $\vx$ is the estimated mean of $Y$ given $\vX=\vx$:
$$\hat y \eqdef \hE{Y|\vX=\vx}$$
:::
---
For linear models,
the predicted value can be straightforwardly calculated
by multiplying each predictor value $x_j$ by its corresponding coefficient $\beta_j$
and adding up the results:
$$
\begin{aligned}
\hat y &= \hE{Y|\vX=\vx} \\
&= \vx'\hat\beta \\
&= \hat\beta_0\cdot 1 + \hat\beta_1 x_1 + ... + \hat\beta_p x_p
\end{aligned}
$$
---
### Example: prediction for the `birthweight` data
```{r}
x <- c(1, 1, 40)
sum(x * coef(bw_lm1))
```
R has built-in functions for prediction:
```{r}
x <- tibble(age = 40, sex = "male")
bw_lm1 |> predict(newdata = x)
```
If you don't provide `newdata`,
R will use the covariate values from the original dataset:
```{r}
predict(bw_lm1)
```
These special predictions are called the *fitted values* of the dataset:
:::{#def-fitted-value}
For a given dataset $(\vY, \mX)$ and corresponding fitted model $\p_{\hb}(\vy|\mx)$,
the **fitted value** of $y_i$ is
the predicted value of $y$ when $\vX=\vx_i$ using the estimate parameters $\hb$.
:::
R has an extra function to get these values:
```{r}
fitted(bw_lm1)
```
### Confidence intervals {#sec-se-fitted}
Use `predict(se.fit = TRUE)` to compute SEs for predicted values:
```{r}
bw_lm1 |>
predict(
newdata = x,
se.fit = TRUE
)
```
The output of `predict.lm(se.fit = TRUE)` is a `list()`;
you can extract the elements with `$` or `magrittr::use_series()`:
```{r}
library(magrittr)
bw_lm1 |>
predict(
newdata = x,
se.fit = TRUE
) |>
use_series(se.fit)
```
---
We can construct **confidence intervals** for $\E{Y|X=x}$
using the usual formula:
$$\mu(\vx) \in
\paren{\red{\hat{\mu}(\vx)} \pm \blue{\zeta_\alpha}}$$
$$
\blue{\zeta_\alpha} =
t_{n-p}\paren{1-\frac{\alpha}{2}} * \hse{\hat{\mu}(\vx)}
$$
$$\red{\hat{\mu}(\vx)} = \vx \cdot \hb$$
$$\se{\hat{\mu}(\vx)} = \sqrt{\Var{\hat{\mu}(\vx)}}$$
$$
\ba
\Var{\hat{\mu}(\vx)} &= \Var{x'\hat{\beta}}
\\&= x' \Var{\hat{\beta}} x
\\&= x' \sigma^2(\mX'\mX)^{-1} x
\\&= \sigma^2 x' (\mX'\mX)^{-1} x
\\&= \sumin \sumjn x_i x_j \Covs{\hb_i}{\hb_j}
\ea
$$
$$\hVar{\hat{\mu}(\vx)} = \hs^2 x' (\mX'\mX)^{-1} x$$
```{R}
bw_lm2 |> predict(
newdata = x,
interval = "confidence"
)
```
---
:::{#fig-pred-int}
```{r}
library(sjPlot)
bw_lm2 |>
  plot_model(type = "pred", terms = c("age", "sex"), show.data = TRUE) +
  theme_sjplot() +
  theme(legend.position = "bottom")
```
Predicted values and confidence bands for the `birthweight` model with interaction term
:::
### Prediction intervals {#sec-se-pred}
We can also construct **prediction intervals** for
the value of a new observation $Y^*$,
given a covariate pattern $\vx^*$:
$$
\ba
\hat{Y^*} &= \hat\mu({\vx}^*) + \hat{\epsilon}^*
\\ \Var{\hat{Y}} &= \Var{\hat\mu} + \Var{\hat\epsilon}
\\ \Var{\hat{Y}} &= \Var{x'\hb} + \Var{\hat\epsilon}
\\ &= {{\vx}^{*\top}} \Var{\hb} {{\vx}^*} + \sigma^2
\\ &= {{\vx}^{*\top}} \paren{\sigma^2(\mX'\mX)^{-1}} {{\vx}^*} + \sigma^2
\\ &= \sigma^2 {{\vx}^{*\top}} (\mX'\mX)^{-1} {{\vx}^*} + \sigma^2
\ea
$${#eq-prediction-var}
::: notes
See @hoggtanis2015 §7.6 (p. 340) for a longer version.
:::
```{r}
#| code-fold: show
bw_lm2 |>
predict(newdata = x, interval = "predict")
```
---
If you don't specify `newdata`, you get a warning:
```{r}
#| code-fold: show
#| warning: true
bw_lm2 |>
predict(interval = "predict") |>
head()
```
The warning from the last command is: "predictions on current data refer to *future* responses" (since you already know what happened to the current data, and thus don't need to predict it).
See `?predict.lm` for more.
---
:::{#fig-pred-int-bw}
```{r}
plot_PIs_and_CIs(bw_lm2, bw)
```
Confidence and prediction intervals for `birthweight` model [-@eq-BW-lm-interact]
:::
## Diagnostics {#sec-diagnose-LMs}
:::{.callout-tip}
This section is adapted from @dobson4e [§6.2-6.3] and
@dunn2018generalized [Chapter 3](https://link.springer.com/chapter/10.1007/978-1-4419-0118-7_3).
:::
### Assumptions in linear regression models {.smaller .scrollable}
{{< include _sec-linreg-assumptions.qmd >}}
### Direct visualization
::: notes
The most direct way to examine the fit of a model is
to compare it to the raw observed data.
:::
```{r}
#| label: fig-bw-interaction2
#| fig-cap: "Birthweight model with interaction term"
bw <-
  bw |>
  mutate(
    predlm2 = predict(bw_lm2)
  ) |>
  arrange(sex, age)

plot1_interact <-
  plot1 %+% bw +
  geom_line(aes(y = predlm2))

print(plot1_interact)
```
::: notes
It's not easy to assess these assumptions from this model.
If there are multiple continuous covariates,
it becomes even harder to visualize the raw data.
:::
---
#### Fitted model for `hers` data {.smaller}
::: notes
Consider the `hers` data from @vittinghoff2e.
{{< include _sec_hers_intro.qmd >}}
:::
:::{#tbl-hers-data}
```{r}
hers <- fs::path_package("rme", "extdata/hersdata.dta") |>
  haven::read_dta()
hers
```
`hers` data
:::
---
::: notes
Suppose we consider models with and without intercept terms (i.e.,
possibly forcing the intercept to go through 0):
:::
```{r}
hers_lm_with_int <- lm(
  na.action = na.exclude,
  LDL ~ smoking * age, data = hers
)


library(equatiomatic)
equatiomatic::extract_eq(hers_lm_with_int)
```
```{r}
hers_lm_no_int <- lm(
  na.action = na.exclude,
  LDL ~ age + smoking:age - 1, data = hers
)

library(equatiomatic)
equatiomatic::extract_eq(hers_lm_no_int)
```
:::{#tbl-hers-maybe-int layout-ncol=2}
:::{#tbl-hers-with-int}
```{r}
library(gtsummary)
hers_lm_with_int |>
  tbl_regression(intercept = TRUE)
```
With intercept
:::
:::{#tbl-hers-no-int}
```{r}
hers_lm_no_int |>
  tbl_regression(intercept = TRUE)
```
No intercept
:::
`hers` data models with and without intercepts
:::
---
:::{#fig-hers-maybe-int layout-ncol=2}
:::{#fig-hers-no-int}
```{r}
library(sjPlot)

hers_plot1 <- hers_lm_no_int |>
  sjPlot::plot_model(
    type = "pred",
    terms = c("age", "smoking"),
    show.data = TRUE
  ) +
  facet_wrap(~group_col, ncol = 1) +
  expand_limits(y = 0) +
  theme(legend.position = "bottom")

hers_plot1
```
No intercept
:::
:::{#fig-hers-with-intercept}
```{r}
library(sjPlot)

hers_plot2 <- hers_lm_with_int |>
  sjPlot::plot_model(
    type = "pred",
    terms = c("age", "smoking"),
    show.data = TRUE
  ) +
  facet_wrap(~group_col, ncol = 1) +
  expand_limits(y = 0) +
  theme(legend.position = "bottom")

hers_plot2
```
With intercept
:::
`hers` data models with and without intercepts
:::
### Residuals
::: notes
Maybe we can transform the data and model in some way
to make it easier to inspect.
:::
{{< include _def-residual-deviation.qmd >}}
---
:::{#thm-gaussian-resid-noise}
#### Residuals in Gaussian models
If $Y$ has a Gaussian distribution,
then $\err(Y)$ also has a Gaussian distribution, and vice versa.
:::
:::{.proof}
Left to the reader.
:::
---
:::{#def-resid-fitted}
#### Residuals of a fitted model value
The **residual of a fitted value $\hat y$** (shorthand: "residual") is its [error](estimation.qmd#def-error) relative to the observed data:
$$
\ba
e(\hat y) &\eqdef \erf{\hat y}
\\&= y - \hat y
\ea
$$
:::
---
:::{#exm-resid-bw}
#### residuals in `birthweight` data
:::{#fig-bw-resids1}
```{r}
plot1_interact +
  facet_wrap(~sex) +
  geom_segment(
    aes(
      x = age,
      y = predlm2,
      xend = age,
      yend = weight,
      col = sex,
      group = id
    ),
    linetype = "dotted"
  )
```
Fitted values and residuals for interaction model for `birthweight` data
:::
:::
---
#### Residuals of fitted values vs residual noise
$e(\hat y)$ can be seen as the maximum likelihood estimate of the residual noise:
$$
\ba
e(\hy) &= y - \hat y
\\ &= \hat\eps_{ML}
\ea
$$
---
#### General characteristics of residuals
:::{#thm-resid-unbiased}
If $\hExpf{Y}$ is an [unbiased](estimation.qmd#sec-unbiased-estimators)
estimator of the mean $\Expf{Y}$, then:
$$\E{e(y)} = 0$$ {#eq-mean-resid-unbiased}
$$\Var{e(y)} \approx \ss$$ {#eq-var-resid-unbiased}
:::
---
:::{.proof}
\
@eq-mean-resid-unbiased:
$$
\ba
\Ef{e(y)} &= \Ef{y - \hat y}
\\ &= \Ef{y} - \Ef{\hat y}
\\ &= \Ef{y} - \Ef{y}
\\ &= 0
\ea
$$
@eq-var-resid-unbiased:
$$
\ba
\Var{e(y)} &= \Var{y - \hy}
\\ &= \Var{y} + \Var{\hy} - 2 \Cov{y, \hy}
\\ &{\dot{\approx}} \Var{y} + 0 - 2 \cdot 0
\\ &= \Var{y}
\\ &= \ss
\ea
$$
:::
---
#### Characteristics of residuals in Gaussian models
With enough data and a correct model,
the residuals will be approximately Gaussian distributed,
with variance $\sigma^2$,
which we can estimate using $\hat\sigma^2$;
that is:
$$
e_i \siid N(0, \hat\sigma^2)
$$
---
#### Computing residuals in R
R provides a function for residuals:
```{r}
resid(bw_lm2)
```
---
:::{#exr-calc-resids}
Check R's output by computing the residuals directly.
:::
:::{.solution}
\
```{r}
bw$weight - fitted(bw_lm2)
```
This matches R's output!
:::
---
#### Graphing the residuals
:::{#fig-resid-bw layout-ncol=2}
:::{#fig-bw-resids1-c2}
```{r}
plot1_interact +
  facet_wrap(~sex) +
  geom_segment(
    aes(
      x = age,
      y = predlm2,
      xend = age,
      yend = weight,
      col = sex,
      group = id
    ),
    linetype = "dotted"
  )
```
fitted values
:::
:::{#fig-resids-intxn-bw}
```{r}
bw <- bw |>
mutate(
resids_intxn =
weight - fitted(bw_lm2)
)
plot_bw_resid <-
bw |>
ggplot(aes(
x = age,
y = resids_intxn,
linetype = sex,
shape = sex,
col = sex
)) +
theme_bw() +
xlab("Gestational age (weeks)") +
ylab("residuals (grams)") +
theme(legend.position = "bottom") +
geom_hline(aes(
yintercept = 0,
col = sex
)) +
geom_segment(
aes(yend = 0),
linetype = "dotted"
) +
geom_point()
# expand_limits(y = 0, x = 0) +
geom_point(alpha = .7)
print(plot_bw_resid + facet_wrap(~sex))
```
Residuals
:::
Fitted values and residuals for interaction model for `birthweight` data
:::
---
#### Residuals versus predictors
```{r}
hers <- hers |>
  mutate(
    resids_no_intcpt =
      LDL - fitted(hers_lm_no_int),
    resids_with_intcpt =
      LDL - fitted(hers_lm_with_int)
  )
```
:::{#fig-resids-hers-1 layout-ncol=2}
:::{#fig-resid-hers-pred-no-intcpt}
```{r}
hers |>
  arrange(age) |>
  ggplot() +
  aes(x = age, y = resids_no_intcpt, col = factor(smoking)) +
  geom_point() +
  geom_hline(aes(yintercept = 0, col = factor(smoking))) +
  facet_wrap(~smoking, labeller = "label_both") +
  theme(legend.position = "bottom") +
  geom_smooth(col = "blue")
```
no intercept
:::
:::{#fig-resid-hers-pred-no-intcpt}
```{r}
hers |>
  arrange(age) |>
  ggplot() +
  aes(x = age, y = resids_with_intcpt, col = factor(smoking)) +
  geom_point() +
  geom_hline(aes(yintercept = 0, col = factor(smoking))) +
  facet_wrap(~smoking, labeller = "label_both") +
  theme(legend.position = "bottom") +
  geom_smooth(col = "blue")
```
with intercept
:::
Residuals of `hers` data vs predictors
:::
---
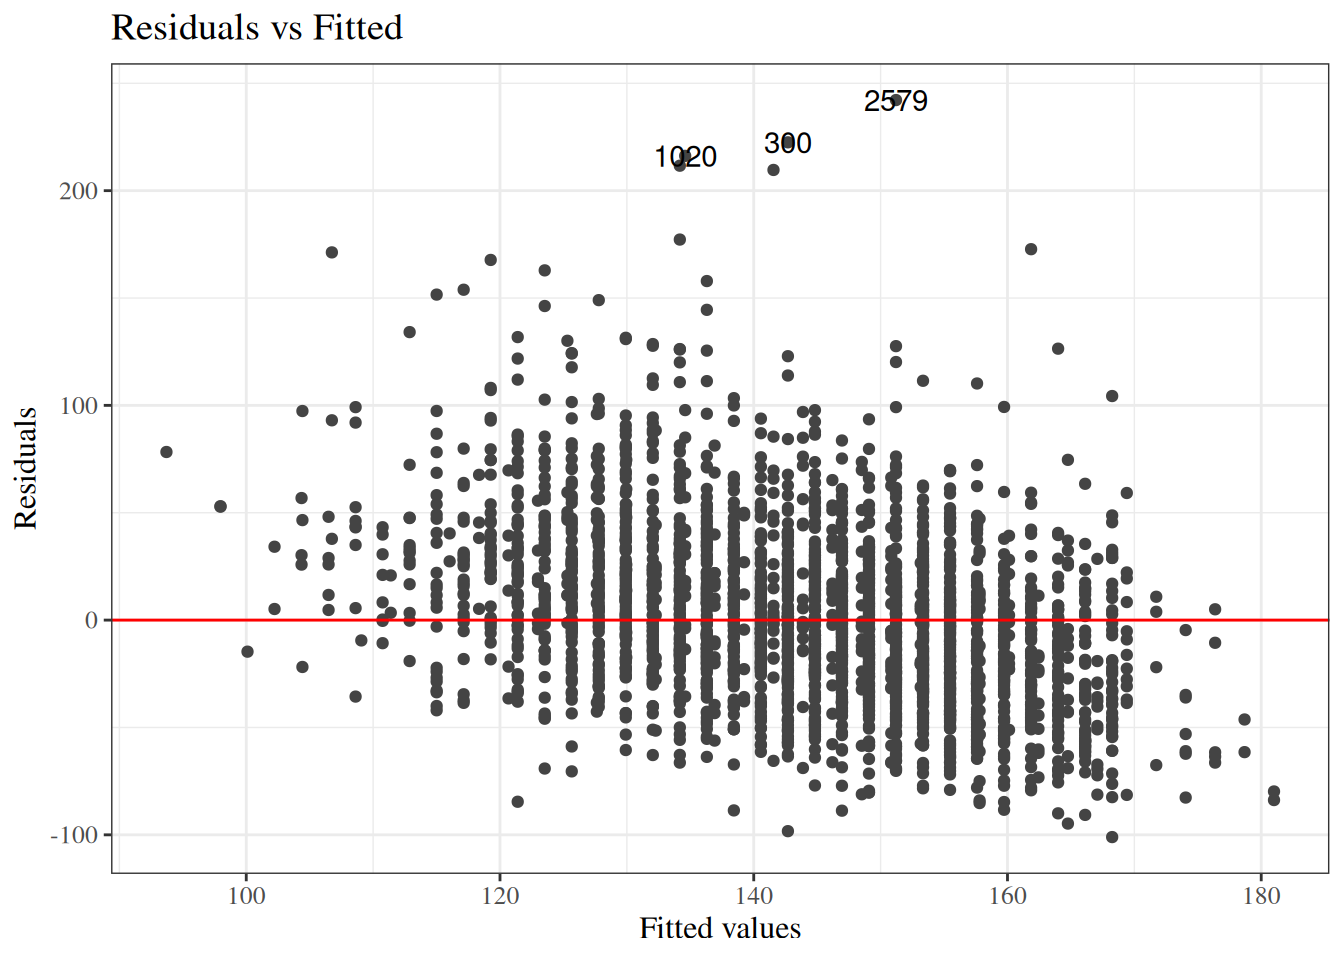
#### Residuals versus fitted values
::: notes
If the model contains multiple continuous covariates,
how do we check for errors in the mean structure assumption?
:::
```{r}
#| label: fig-resids-intxn-hers
#| fig-cap: "Residuals of interaction model for `hers` data"
library(ggfortify)
hers_lm_no_int |>
  update(na.action = na.omit) |>
  autoplot(
    which = 1,
    ncol = 1,
    smooth.colour = NA
  ) +
  geom_hline(yintercept = 0, col = "red")
```
---
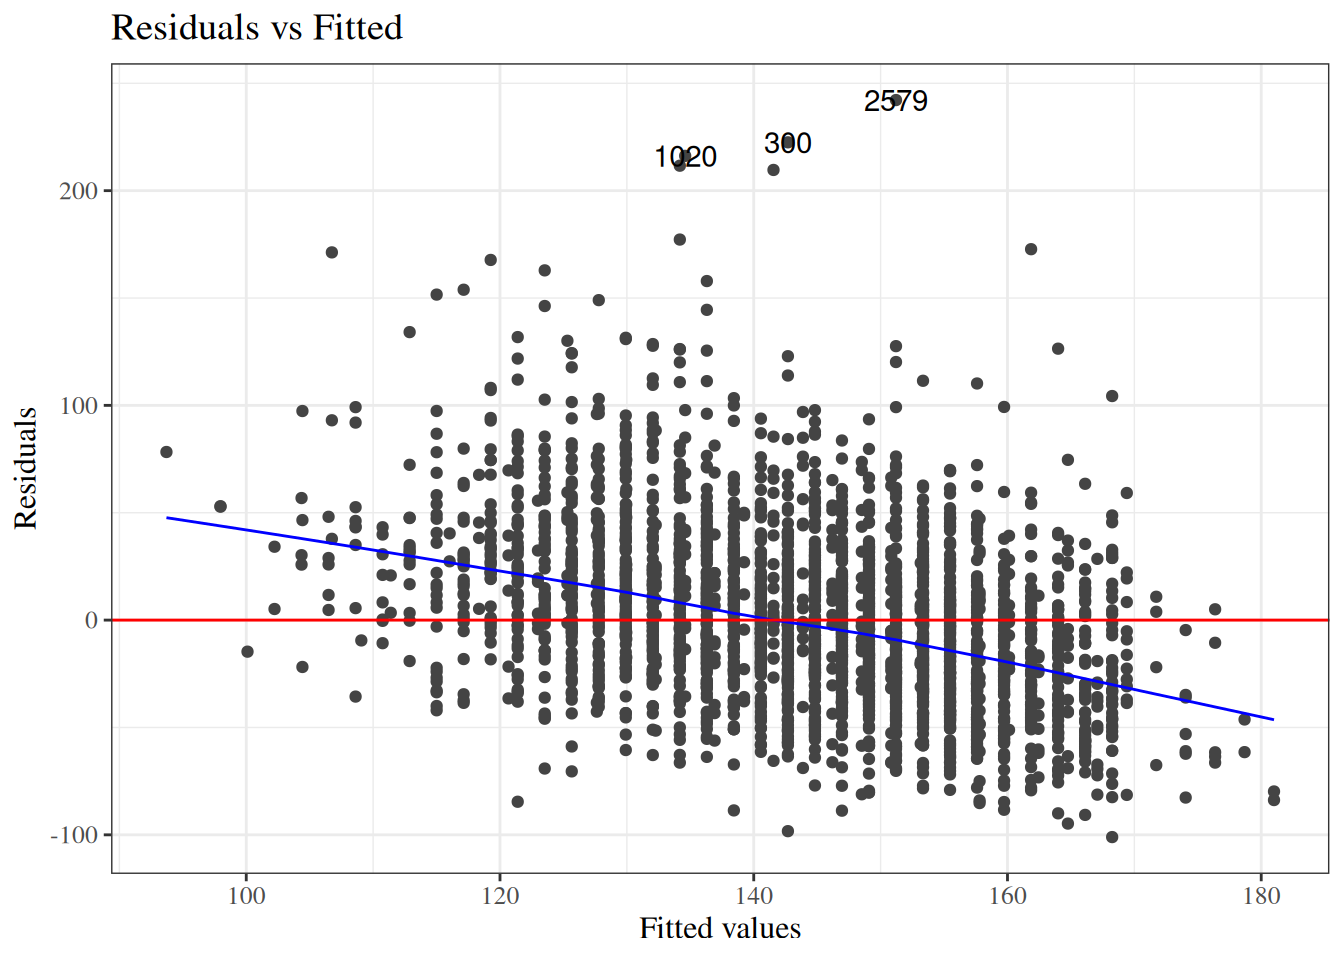
We can add a LOESS smooth to visualize where the residual mean is nonzero:
```{r}
#| label: fig-resids-intxn-hers-smooth-no-int
#| fig-cap: "Residuals of interaction model for `hers` data, no intercept term"
library(ggfortify)
hers_lm_no_int |>
  update(na.action = na.omit) |>
  autoplot(
    which = 1,
    ncol = 1
  ) +
  geom_hline(yintercept = 0, col = "red")
```
---
:::{#fig-resid-hers-compare layout-ncol=2}
:::{#fig-resids-intxn-hers-smooth-no-int-2}
```{r}
library(ggfortify)
hers_lm_no_int |>
  update(na.action = na.omit) |>
  autoplot(
    which = 1,
    ncol = 1
  ) +
  geom_hline(yintercept = 0, col = "red")
```
no intercept term
:::
:::{#fig-resids-intxn-hers-smooth-with-int}
```{r}
hers_lm_with_int |>
  update(na.action = na.omit) |>
  autoplot(
    which = 1,
    ncol = 1
  ) +
  geom_hline(yintercept = 0, col = "red")
```
with intercept term
:::
Residuals of interaction model for `hers` data, with and without intercept term
:::
---
:::{#def-stred}
#### Standardized residuals
$$r_i = \frac{e_i}{\widehat{SD}(e_i)}$$
:::
Hence, with enough data and a correct model, the standardized residuals will be approximately standard Gaussian; that is,
$$
r_i \siid N(0,1)
$$
### Marginal distributions of residuals
To look for problems with our model, we can check whether the residuals $e_i$ and standardized residuals $r_i$ look like they have the distributions that they are supposed to have, according to the model.
---
#### Standardized residuals in R
```{r}
rstandard(bw_lm2)
resid(bw_lm2) / sigma(bw_lm2)
```
::: notes
These are not quite the same, because R is doing something more complicated and precise to get the standard errors. Let's not worry about those details for now; the difference is pretty small in this case:
:::
---
```{r}
rstandard_compare_plot <-
  tibble(
    x = resid(bw_lm2) / sigma(bw_lm2),
    y = rstandard(bw_lm2)
  ) |>
  ggplot(aes(x = x, y = y)) +
  geom_point() +
  theme_bw() +
  coord_equal() +
  xlab("resid(bw_lm2)/sigma(bw_lm2)") +
  ylab("rstandard(bw_lm2)") +
  geom_abline(
    aes(
      intercept = 0,
      slope = 1,
      col = "x=y"
    )
  ) +
  labs(colour = "") +
  scale_colour_manual(values = "red")

print(rstandard_compare_plot)
```
---
Let's add these residuals to the `tibble` of our dataset:
```{r}
bw <-
  bw |>
  mutate(
    fitted_lm2 = fitted(bw_lm2),
    resid_lm2 = resid(bw_lm2),
    resid_lm2_alt = weight - fitted_lm2,
    std_resid_lm2 = rstandard(bw_lm2),
    std_resid_lm2_alt = resid_lm2 / sigma(bw_lm2)
  )

bw |>
  select(
    sex,
    age,
    weight,
    fitted_lm2,
    resid_lm2,
    std_resid_lm2
  )
```
---
::: notes
Now let's build histograms:
:::
```{r}
#| fig-cap: "Marginal distribution of (nonstandardized) residuals"
#| label: fig-marg-dist-resid
resid_marginal_hist <-
  bw |>
  ggplot(aes(x = resid_lm2)) +
  geom_histogram()

print(resid_marginal_hist)
```
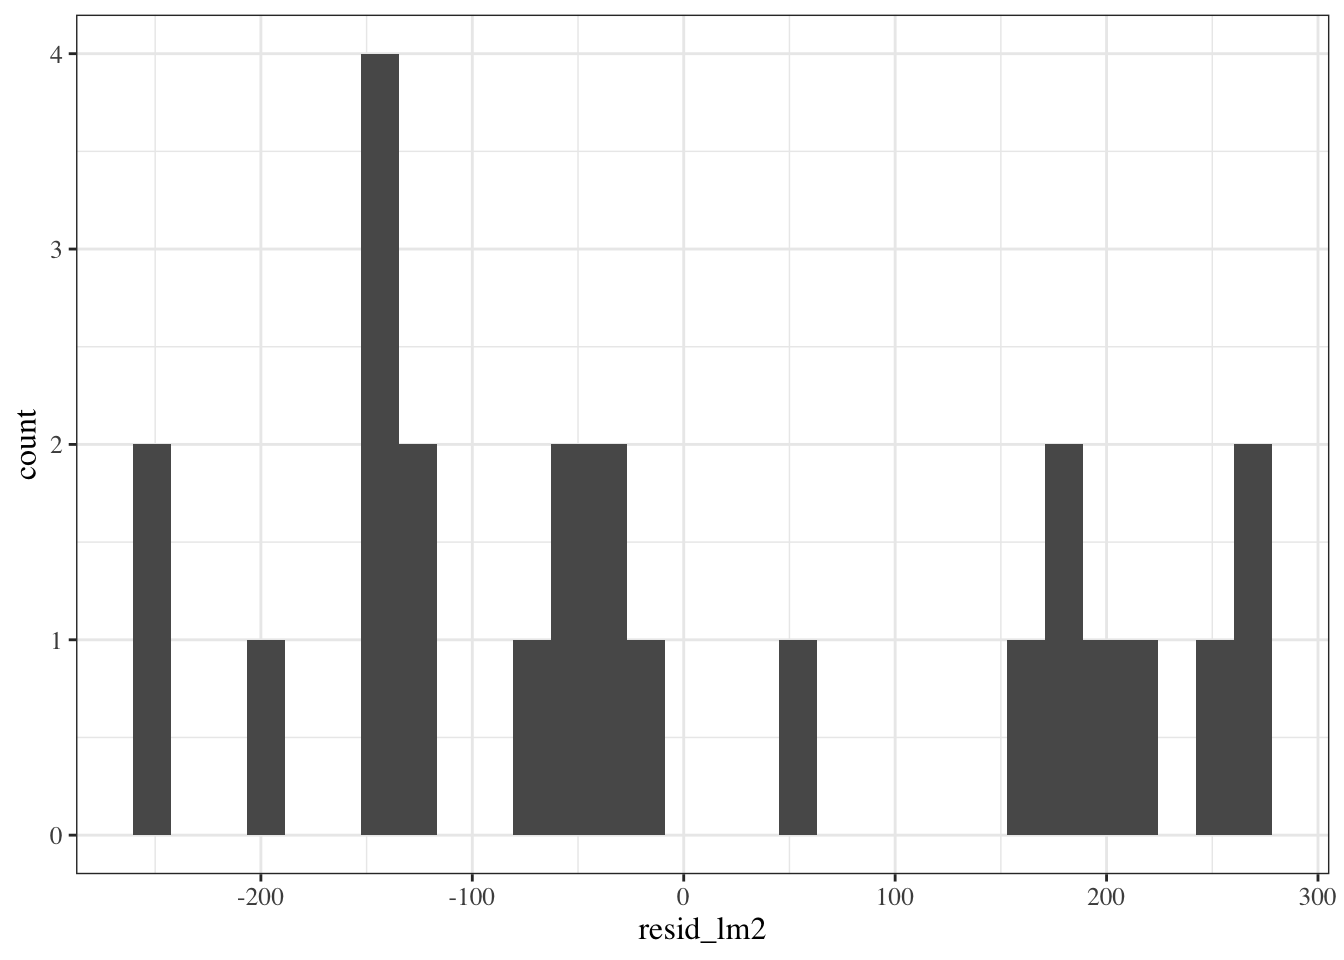
::: notes
Hard to tell with this small amount of data, but I'm a bit concerned that the histogram doesn't show a bell-curve shape.
:::
---
```{r}
#| fig-cap: "Marginal distribution of standardized residuals"
#| label: fig-marg-stresd
std_resid_marginal_hist <-
  bw |>
  ggplot(aes(x = std_resid_lm2)) +
  geom_histogram()

print(std_resid_marginal_hist)
```
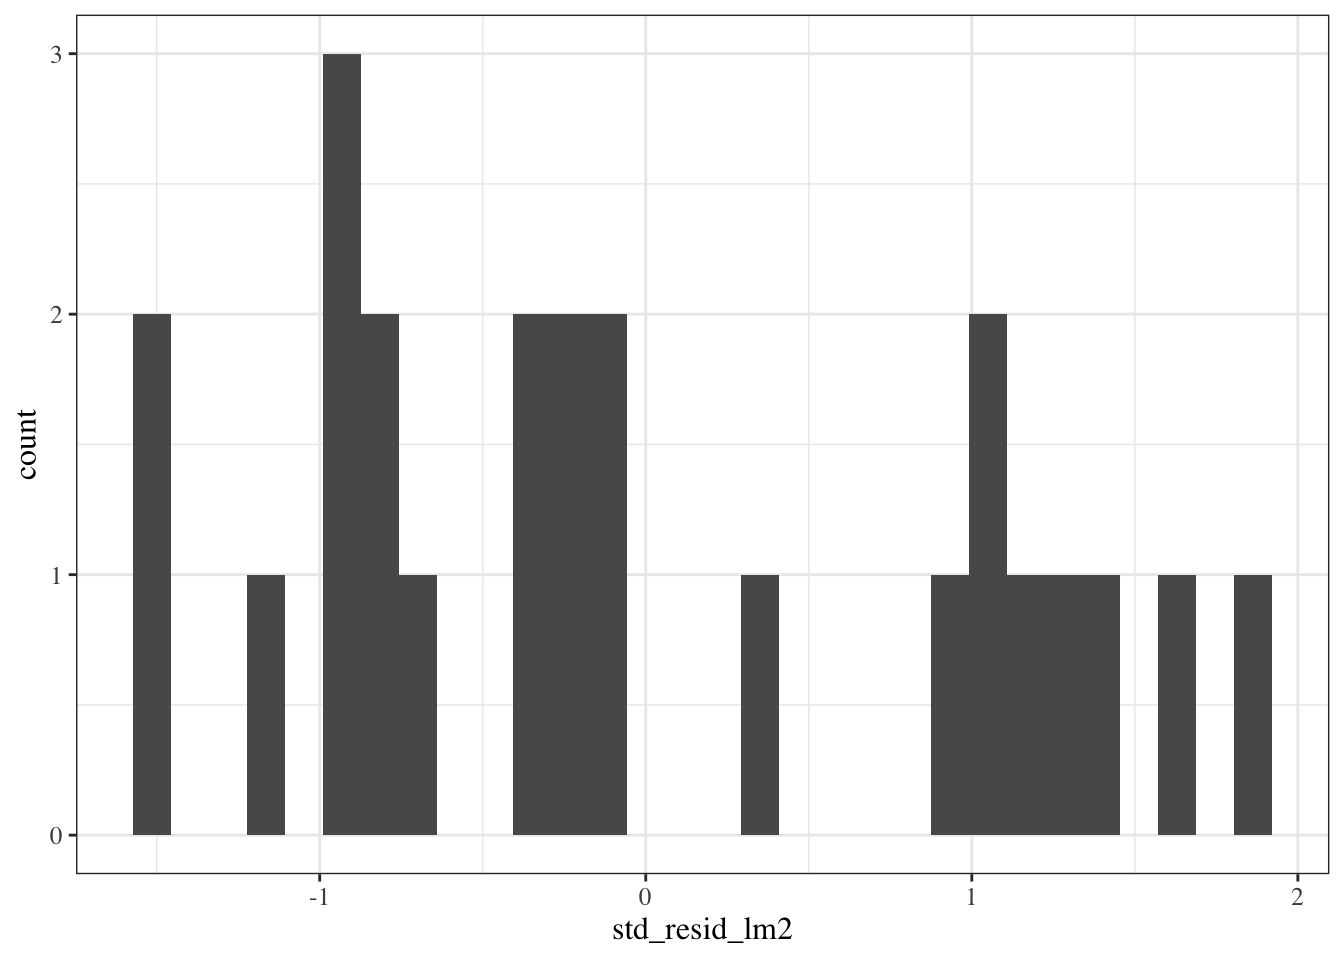
::: notes
This looks similar, although the scale of the x-axis got narrower, because we divided by $\hat\sigma$ (roughly speaking).
Still hard to tell if the distribution is Gaussian.
:::
---
### QQ plot of standardized residuals
::: notes
Another way to assess normality is the QQ plot of the standardized residuals versus normal quantiles:
:::
```{r}
library(ggfortify)
# needed to make ggplot2::autoplot() work for `lm` objects

qqplot_lm2_auto <-
  bw_lm2 |>
  autoplot(
    which = 2, # options are 1:6; can do multiple at once
    ncol = 1
  ) +
  theme_classic()

print(qqplot_lm2_auto)
```
::: notes
If the Gaussian model were correct, these points should follow the dotted line.
Fig 2.4 panel (c) in @dobson4e is a little different; they didn't specify how they produced it, but other statistical analysis systems do things differently from R.
See also @dunn2018generalized [§3.5.4](https://link.springer.com/chapter/10.1007/978-1-4419-0118-7_3#Sec14:~:text=3.5.4%20Q%E2%80%93Q%20Plots%20and%20Normality).
:::
---
#### QQ plot - how it's built
::: notes
Let's construct it by hand:
:::
```{r}
bw <- bw |>
  mutate(
    p = (rank(std_resid_lm2) - 1 / 2) / n(), # "Blom's method"
    expected_quantiles_lm2 = qnorm(p)
  )

qqplot_lm2 <-
  bw |>
  ggplot(
    aes(
      x = expected_quantiles_lm2,
      y = std_resid_lm2,
      col = sex,
      shape = sex
    )
  ) +
  geom_point() +
  theme_classic() +
  theme(legend.position = "none") + # removing the plot legend
  ggtitle("Normal Q-Q") +
  xlab("Theoretical Quantiles") +
  ylab("Standardized residuals")

# find the expected line:

ps <- c(.25, .75) # reference probabilities
a <- quantile(rstandard(bw_lm2), ps) # empirical quantiles
b <- qnorm(ps) # theoretical quantiles

qq_slope <- diff(a) / diff(b)
qq_intcpt <- a[1] - b[1] * qq_slope

qqplot_lm2 <-
  qqplot_lm2 +
  geom_abline(slope = qq_slope, intercept = qq_intcpt)

print(qqplot_lm2)
```
---
### Conditional distributions of residuals
If our Gaussian linear regression model is correct, the residuals $e_i$ and standardized residuals $r_i$ should have:
- an approximately Gaussian distribution, with:
- a mean of 0
- a constant variance
This should be true **for every** value of $x$.
---
If we didn't correctly guess the functional form of the linear component of the mean,
$$\text{E}[Y|X=x] = \beta_0 + \beta_1 X_1 + ... + \beta_p X_p$$
Then the residuals might have nonzero mean.
Regardless of whether we guessed the mean function correctly, ther the variance of the residuals might differ between values of $x$.
---
#### Residuals versus fitted values
::: notes
To look for these issues, we can plot the residuals $e_i$ against the fitted values $\hat y_i$ (@fig-bw_lm2-resid-vs-fitted).
:::
:::{#fig-bw_lm2-resid-vs-fitted}
```{r}
autoplot(bw_lm2, which = 1, ncol = 1) |> print()
```
`birthweight` model (@eq-BW-lm-interact): residuals versus fitted values
:::
::: notes
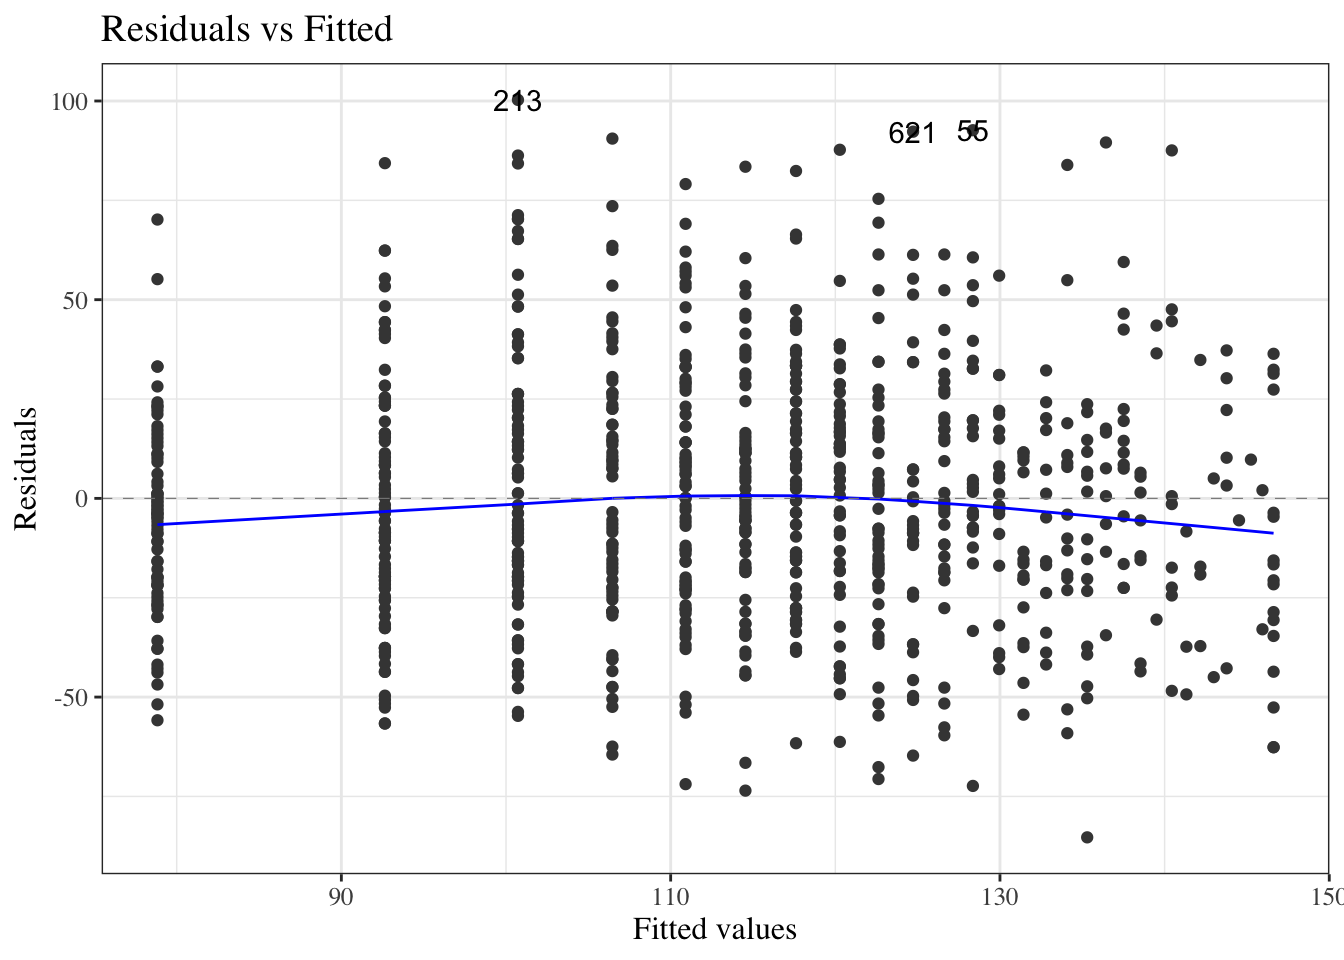
If the model is correct, the blue line should stay flat and close to 0, and the cloud of dots should have the same vertical spread regardless of the fitted value.
If not, we probably need to change the functional form of linear component of the mean, $$\text{E}[Y|X=x] = \beta_0 + \beta_1 X_1 + ... + \beta_p X_p$$
:::
---
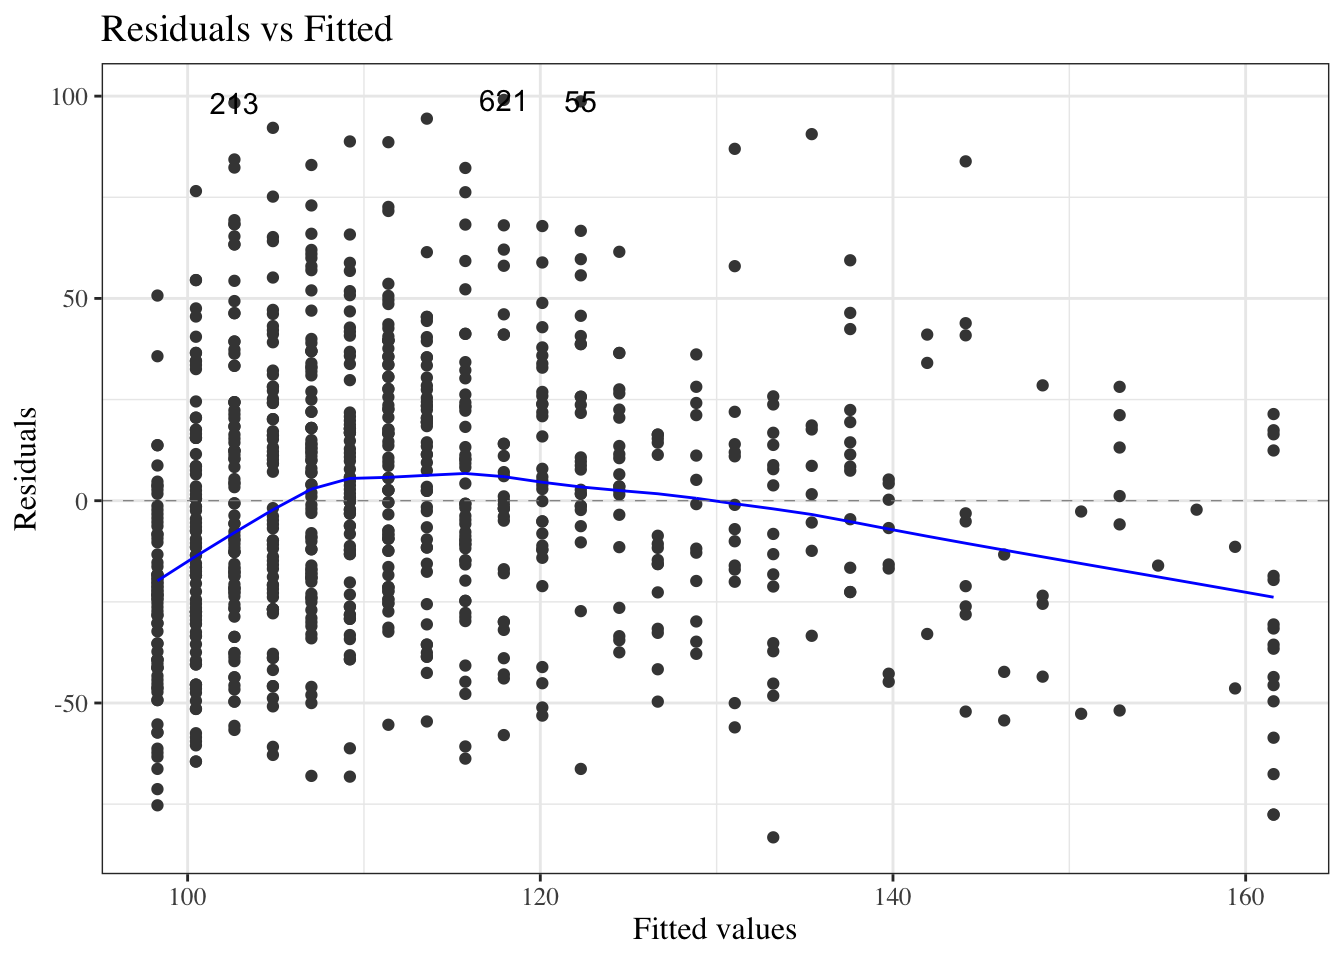
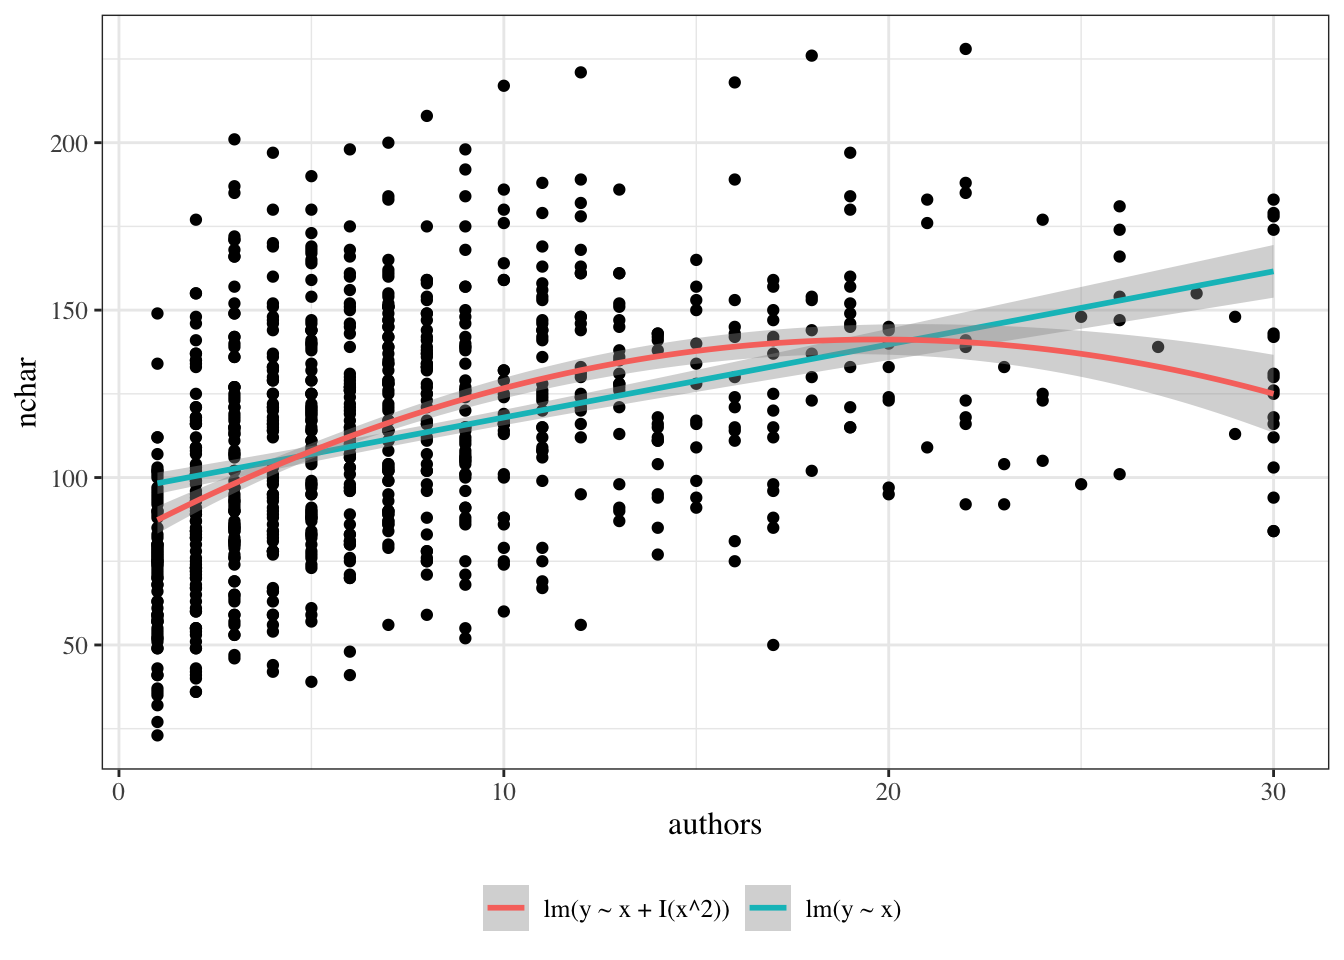
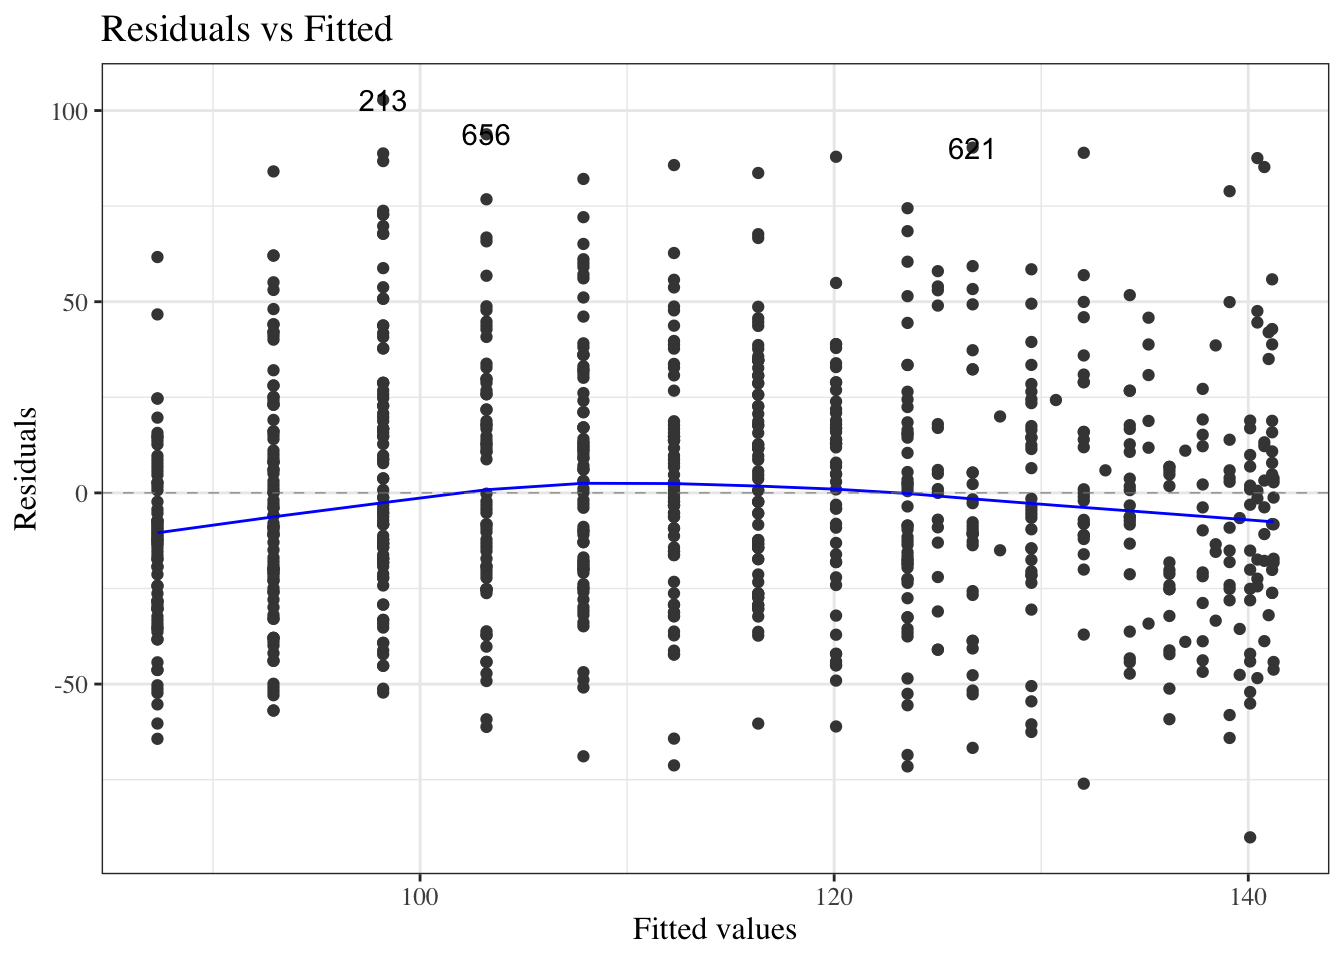
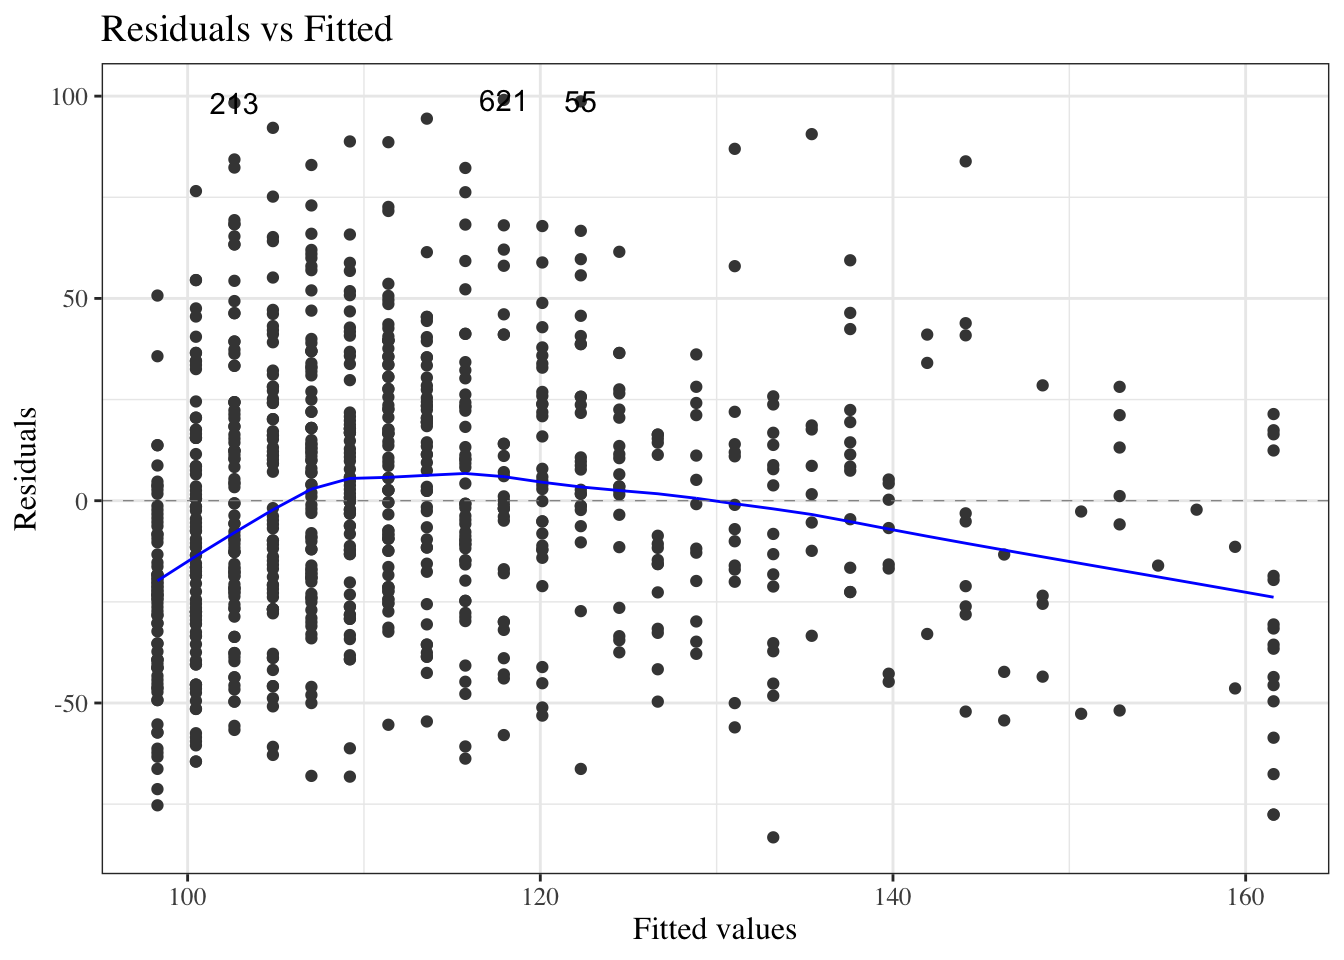
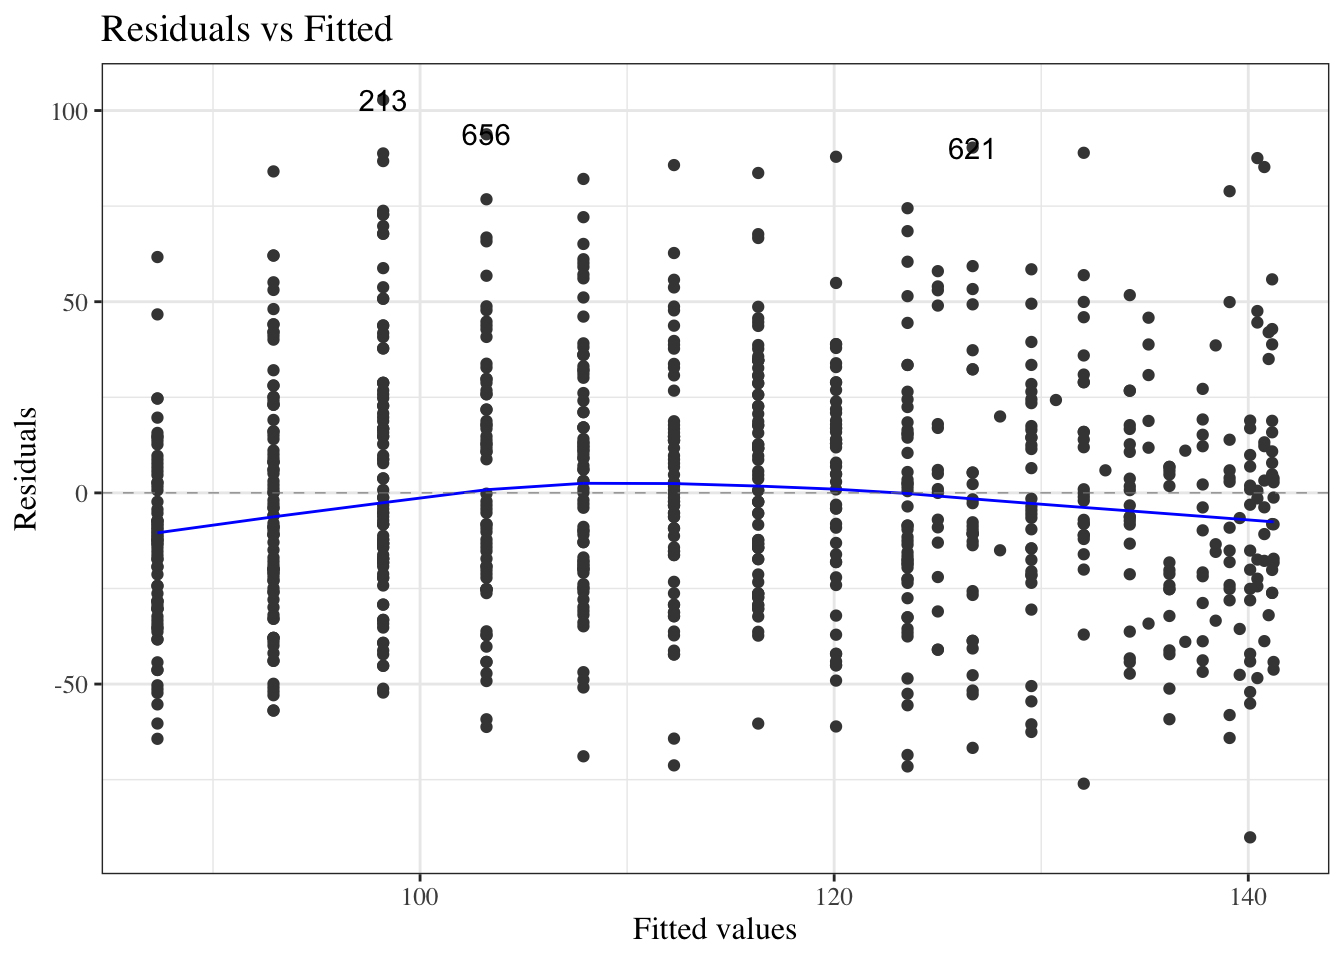
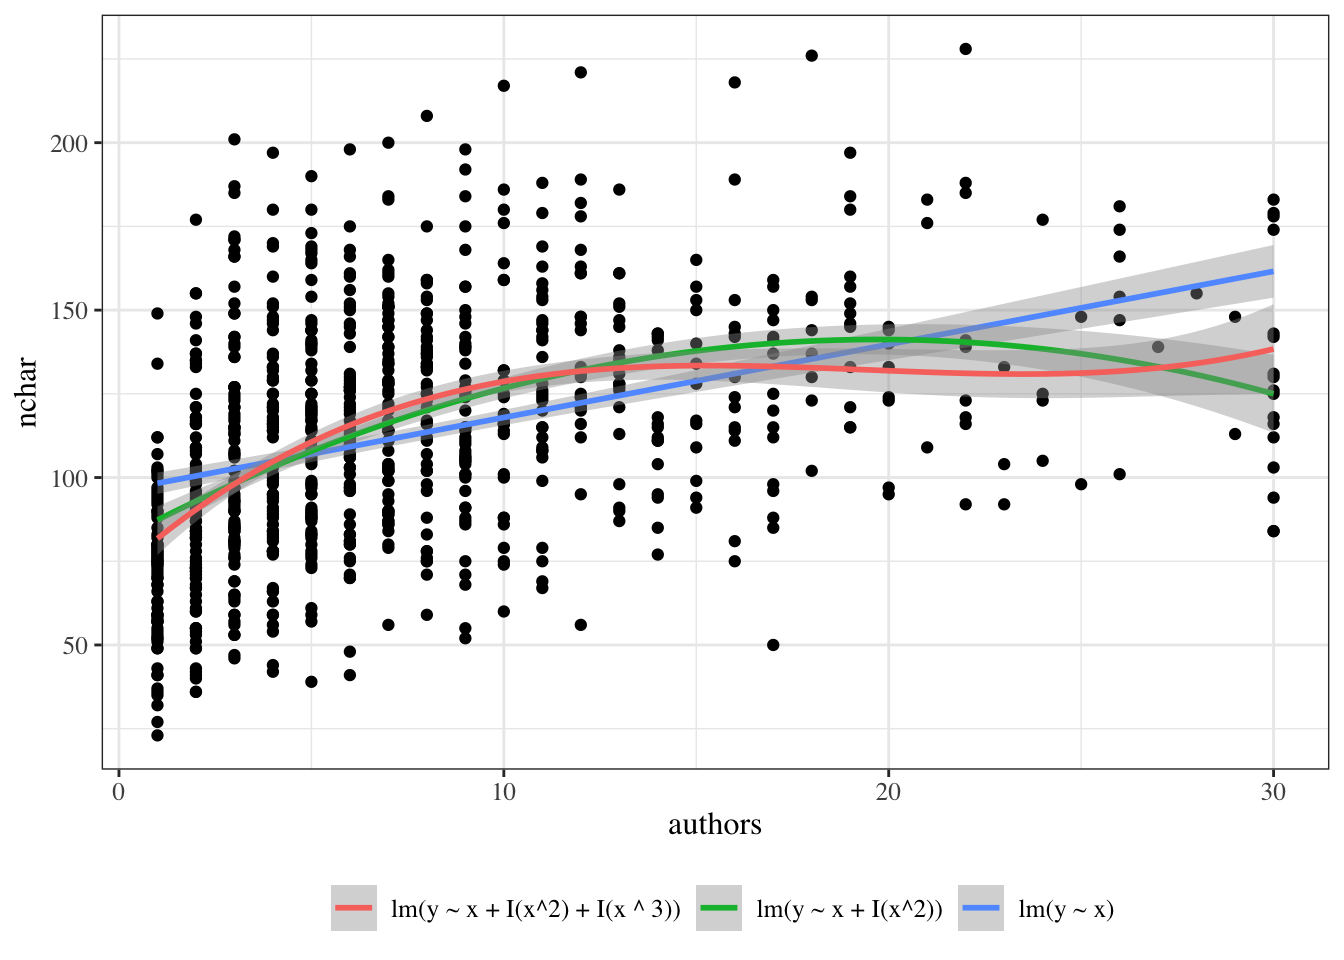
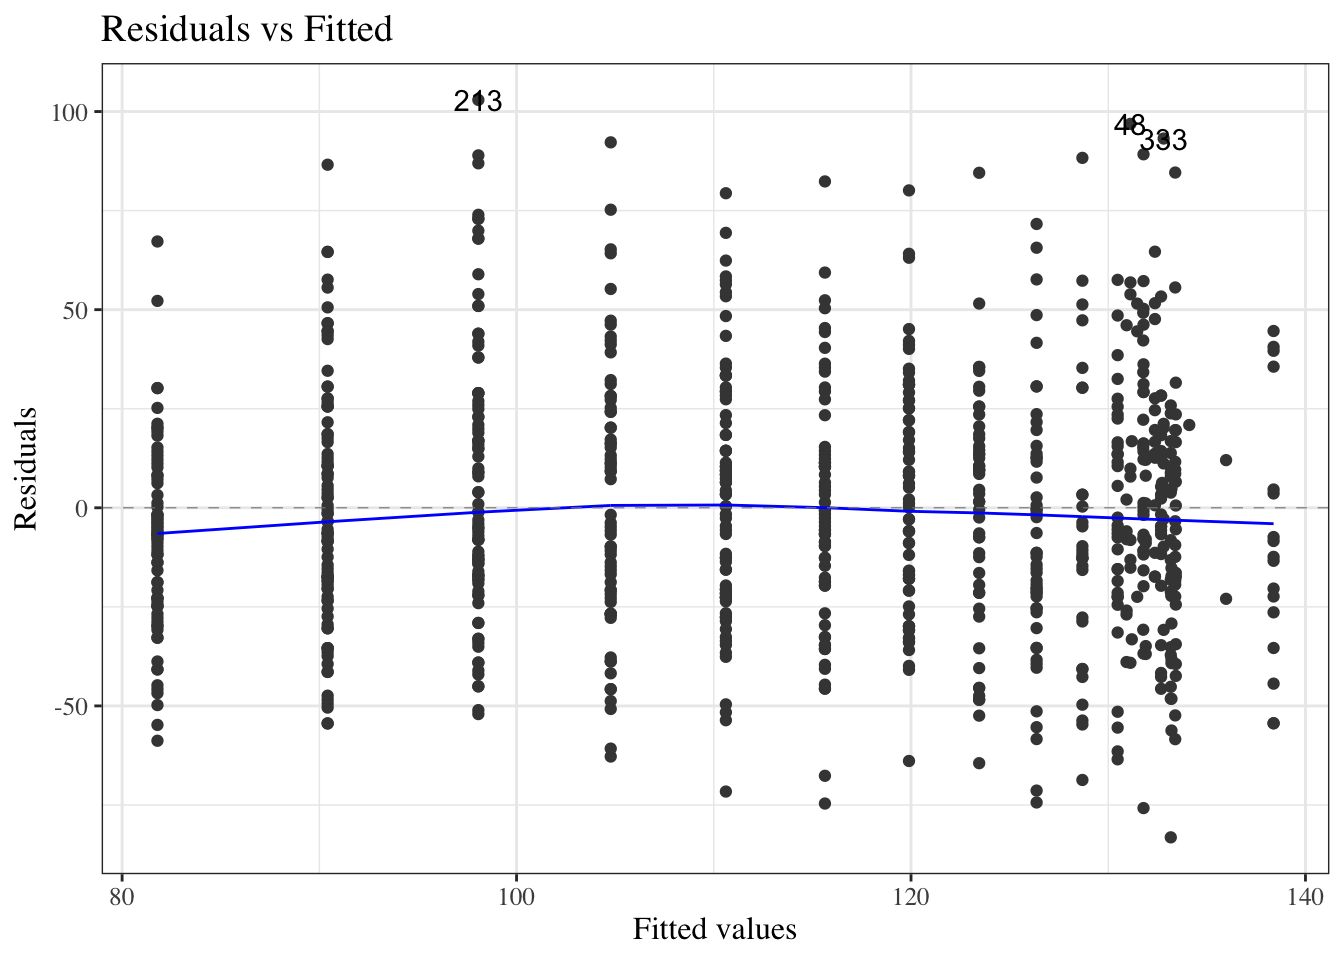
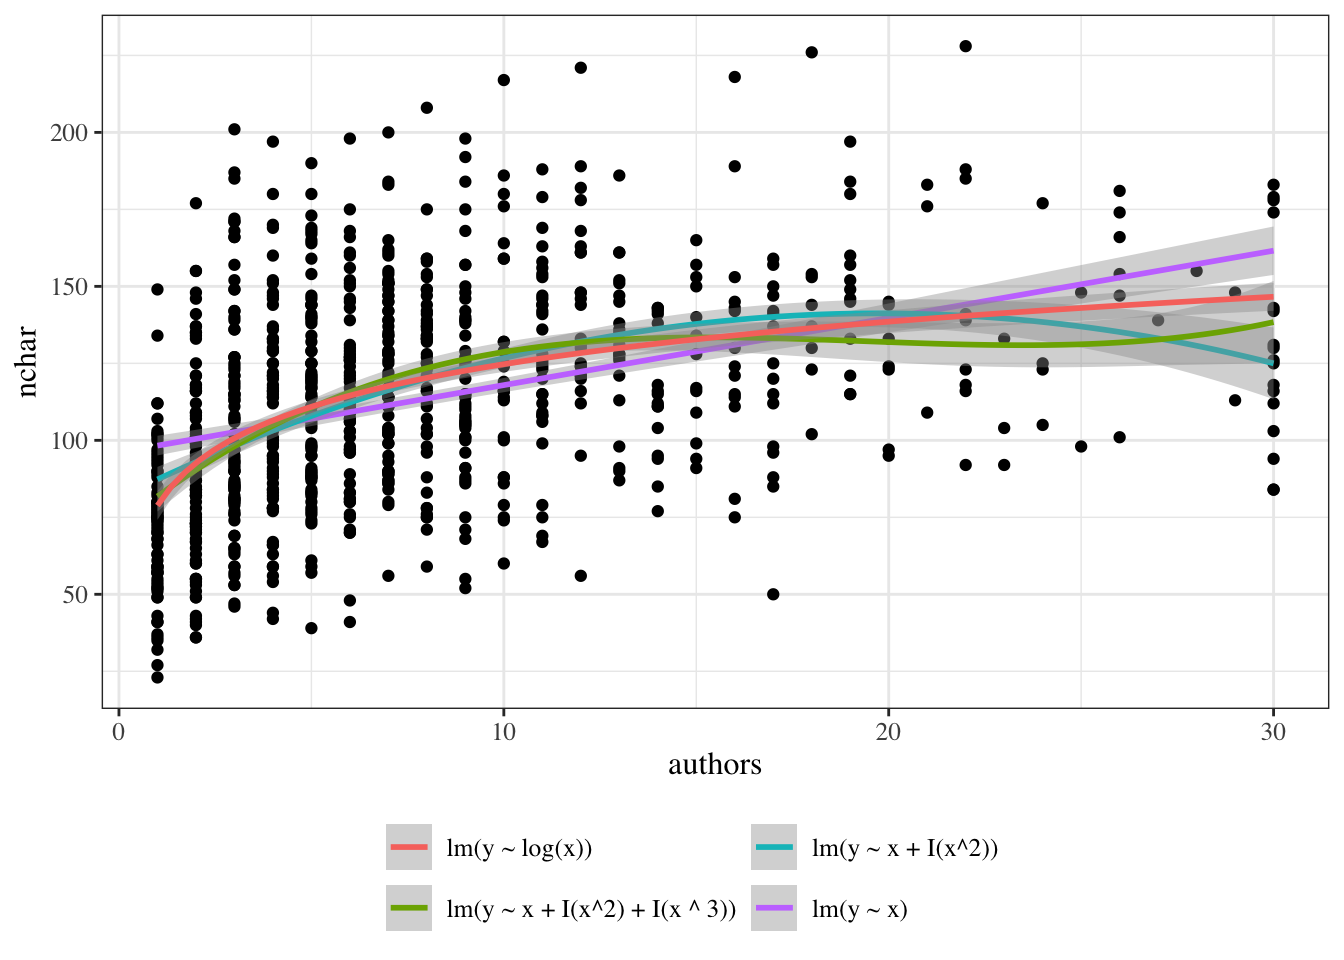
{{< include exm-plot-fits.qmd >}}
---
#### Scale-location plot
::: notes
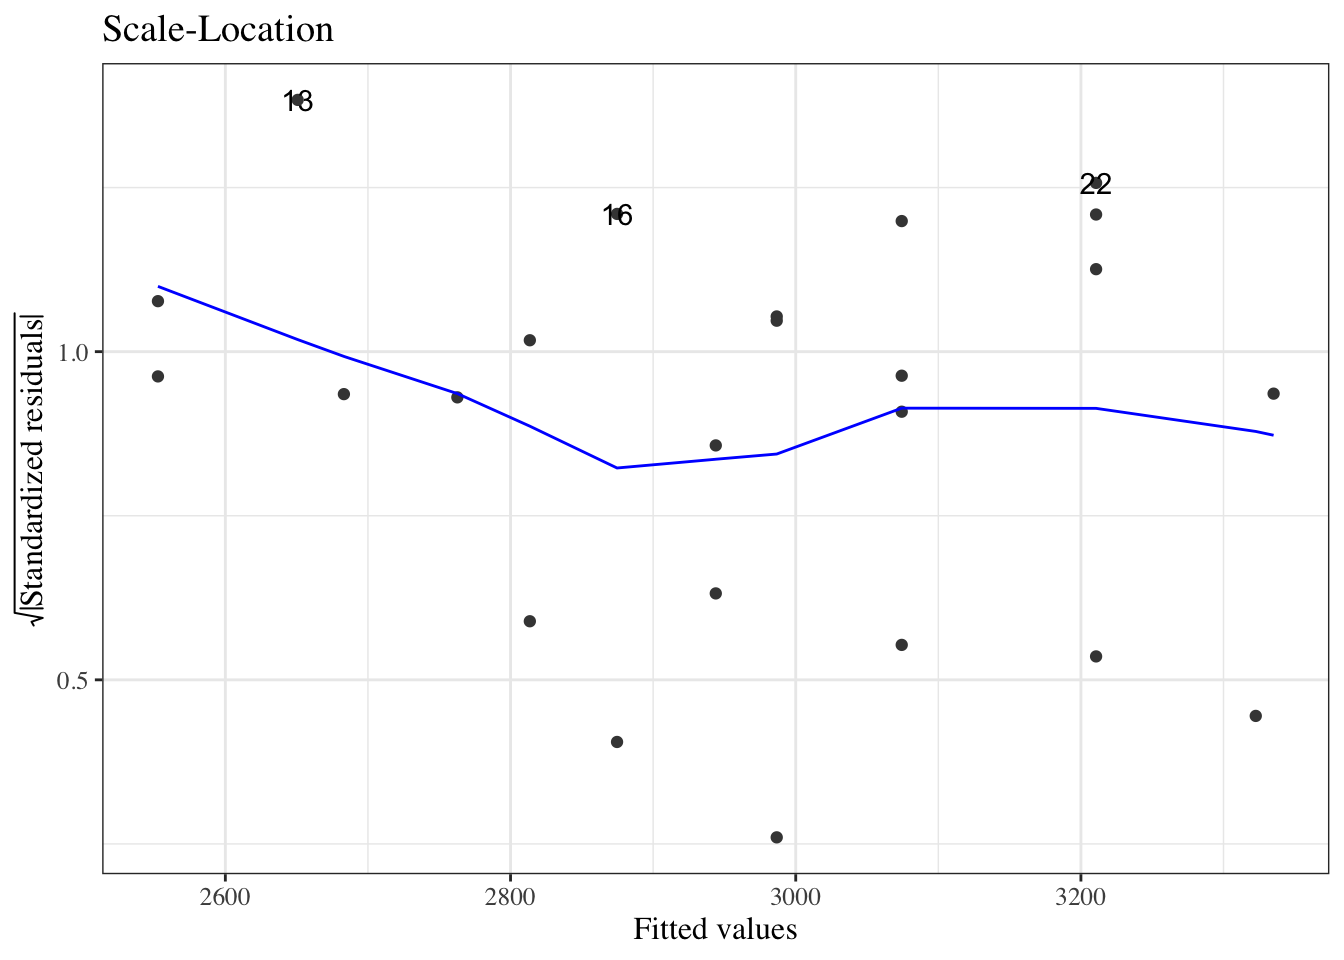
We can also plot the square roots of the absolute values of the standardized residuals against the fitted values (@fig-bw-scale-loc).
:::
```{r}
#| label: fig-bw-scale-loc
#| fig-cap: "Scale-location plot of `birthweight` data"
autoplot(bw_lm2, which = 3, ncol = 1) |> print()
```
::: notes
Here, the blue line doesn't need to be near 0,
but it should be flat.
If not, the residual variance $\sigma^2$ might not be constant,
and we might need to transform our outcome $Y$
(or use a model that allows non-constant variance).
:::
---
#### Residuals versus leverage
::: notes
We can also plot our standardized residuals against "leverage", which roughly speaking is a measure of how unusual each $x_i$ value is. Very unusual $x_i$ values can have extreme effects on the model fit, so we might want to remove those observations as outliers, particularly if they have large residuals.
:::
::: {#fig-bw_lm2_resid-vs-leverage}
```{r}
autoplot(bw_lm2, which = 5, ncol = 1) |> print()
```
`birthweight` model with interactions (@eq-BW-lm-interact): residuals versus leverage
:::
::: notes
The blue line should be relatively flat and close to 0 here.
:::
---
### Diagnostics constructed by hand
```{r}
bw <-
  bw |>
  mutate(
    predlm2 = predict(bw_lm2),
    residlm2 = weight - predlm2,
    std_resid = residlm2 / sigma(bw_lm2),
    # std_resid_builtin = rstandard(bw_lm2), # uses leverage
    sqrt_abs_std_resid = std_resid |> abs() |> sqrt()
  )
```
##### Residuals vs fitted
```{r}
resid_vs_fit <- bw |>
  ggplot(
    aes(x = predlm2, y = residlm2, col = sex, shape = sex)
  ) +
  geom_point() +
  theme_classic() +
  geom_hline(yintercept = 0)

print(resid_vs_fit)
```
##### Standardized residuals vs fitted
```{r}
bw |>
  ggplot(
    aes(x = predlm2, y = std_resid, col = sex, shape = sex)
  ) +
  geom_point() +
  theme_classic() +
  geom_hline(yintercept = 0)
```
##### Standardized residuals vs gestational age
```{r}
bw |>
  ggplot(
    aes(x = age, y = std_resid, col = sex, shape = sex)
  ) +
  geom_point() +
  theme_classic() +
  geom_hline(yintercept = 0)
```
##### `sqrt(abs(rstandard()))` vs fitted
Compare with `autoplot(bw_lm2, 3)`
```{r}
bw |>
  ggplot(
    aes(x = predlm2, y = sqrt_abs_std_resid, col = sex, shape = sex)
  ) +
  geom_point() +
  theme_classic() +
  geom_hline(yintercept = 0)
```
## Model selection
(adapted from @dobson4e §6.3.3; for more information on prediction, see @james2013introduction and @rms2e).
::: notes
If we have a lot of covariates in our dataset, we might want to choose a small subset to use in our model.
There are a few possible metrics to consider for choosing a "best" model.
:::
### Mean squared error
We might want to minimize the **mean squared error**, $\text E[(y-\hat y)^2]$, for new observations that weren't in our data set when we fit the model.
Unfortunately, $$\frac{1}{n}\sum_{i=1}^n (y_i-\hat y_i)^2$$ gives a biased estimate of $\text E[(y-\hat y)^2]$ for new data. If we want an unbiased estimate, we will have to be clever.
---
#### Cross-validation
```{r}
data("carbohydrate", package = "dobson")
library(cvTools)
full_model <- lm(carbohydrate ~ ., data = carbohydrate)
cv_full <-
  full_model |> cvFit(
    data = carbohydrate, K = 5, R = 10,
    y = carbohydrate$carbohydrate
  )

reduced_model <- full_model |> update(formula = ~ . - age)

cv_reduced <-
  reduced_model |> cvFit(
    data = carbohydrate, K = 5, R = 10,
    y = carbohydrate$carbohydrate
  )
```
---
```{r}
results_reduced <-
  tibble(
    model = "wgt+protein",
    errs = cv_reduced$reps[]
  )
results_full <-
  tibble(
    model = "wgt+age+protein",
    errs = cv_full$reps[]
  )

cv_results <-
  bind_rows(results_reduced, results_full)

cv_results |>
  ggplot(aes(y = model, x = errs)) +
  geom_boxplot()
```
---
##### comparing metrics
```{r}
compare_results <- tribble(
  ~model, ~cvRMSE, ~r.squared, ~adj.r.squared, ~trainRMSE, ~loglik,
  "full",
  cv_full$cv,
  summary(full_model)$r.squared,
  summary(full_model)$adj.r.squared,
  sigma(full_model),
  logLik(full_model) |> as.numeric(),
  "reduced",
  cv_reduced$cv,
  summary(reduced_model)$r.squared,
  summary(reduced_model)$adj.r.squared,
  sigma(reduced_model),
  logLik(reduced_model) |> as.numeric()
)

compare_results
```
---
```{r}
anova(full_model, reduced_model)
```
---
#### stepwise regression
::: {.callout-warning}
## Caution about stepwise selection
Stepwise regression has several known problems:
- It tends to select too many variables (overfitting)
- P-values and confidence intervals are biased after selection
- It ignores model uncertainty
- Results can be unstable across different samples
Consider using cross-validation, penalized methods (like Lasso),
or subject-matter knowledge instead.
See @rms2e and @heinze2018variable for more discussion.
:::
```{r}
library(olsrr)
olsrr:::ols_step_both_aic(full_model)
```
---
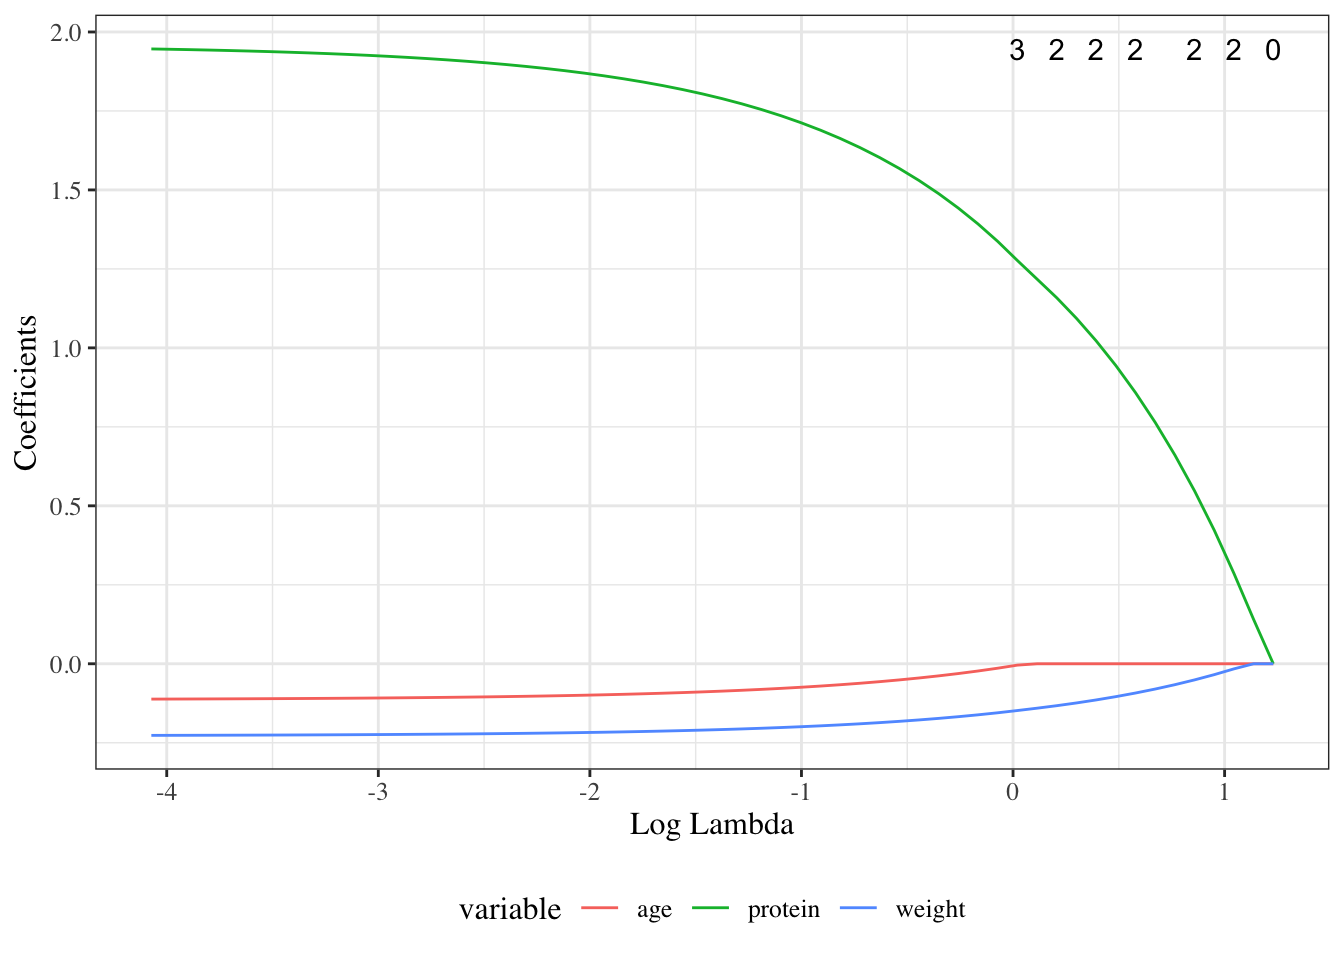
#### Lasso
$$\am_{\theta} \cb{\llik(\th) - \lambda \sum_{j=1}^p|\beta_j|}$$
```{r}
library(glmnet)
y <- carbohydrate$carbohydrate
x <- carbohydrate |>
  select(age, weight, protein) |>
  as.matrix()
fit <- glmnet(x, y)
```
---
```{r}
#| fig-cap: "Lasso selection"
#| label: fig-carbs-lasso
autoplot(fit, xvar = "lambda")
```
---
```{r}
cvfit <- cv.glmnet(x, y)
plot(cvfit)
```
---
```{r}
coef(cvfit, s = "lambda.1se")
```
## Categorical covariates with more than two levels
### Example: `birthweight`
In the birthweight example, the variable `sex` had only two observed values:
```{r}
unique(bw$sex)
```
If there are more than two observed values, we can't just use a single variable with 0s and 1s.
###
:::{.notes}
For example, @tbl-iris-data shows the
[(in)famous](https://www.meganstodel.com/posts/no-to-iris/)
`iris` data (@anderson1935irises),
and @tbl-iris-summary provides summary statistics.
The data include three species: "setosa", "versicolor", and "virginica".
:::
```{r}
#| tbl-cap: "The `iris` data"
#| label: tbl-iris-data
head(iris)
```
```{r}
#| tbl-cap: "Summary statistics for the `iris` data"
#| label: tbl-iris-summary
library(table1)
table1(
  x = ~ . | Species,
  data = iris,
  overall = FALSE
)
```
---
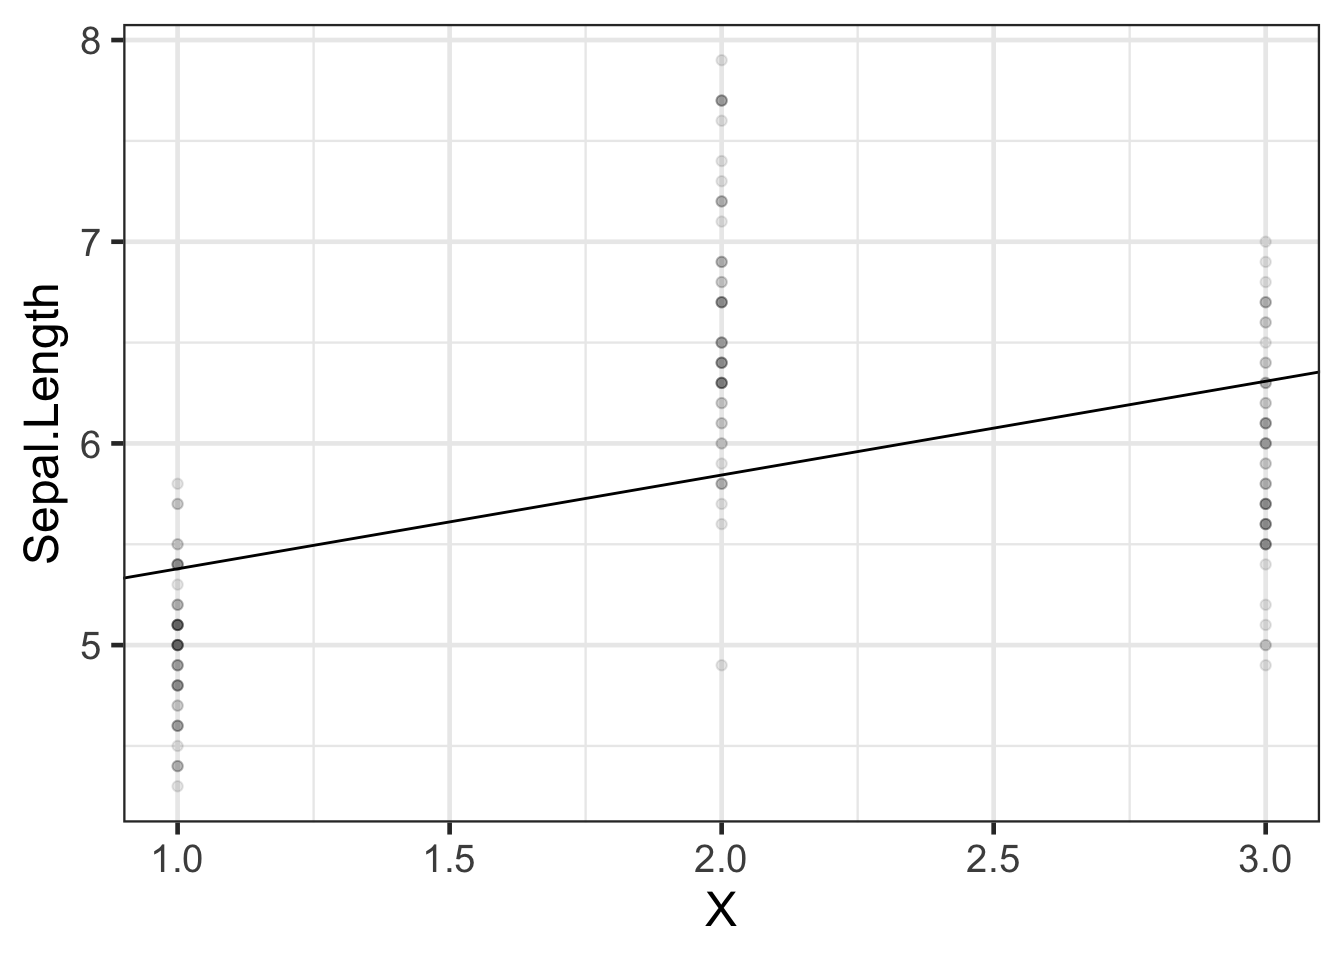
If we want to model `Sepal.Length` by species, we could create a variable $X$ that represents "setosa" as $X=1$, "virginica" as $X=2$, and "versicolor" as $X=3$.
```{r}
#| label: tbl-numeric-coding
#| tbl-cap: "`iris` data with numeric coding of species"
data(iris) # this step is not always necessary, but ensures you're starting
# from the original version of a dataset stored in a loaded package

iris <-
  iris |>
  tibble() |>
  mutate(
    X = case_when(
      Species == "setosa" ~ 1,
      Species == "virginica" ~ 2,
      Species == "versicolor" ~ 3
    )
  )

iris |>
  distinct(Species, X)
```
Then we could fit a model like:
```{r}
#| label: tbl-iris-numeric-species
#| tbl-cap: "Model of `iris` data with numeric coding of `Species`"
iris_lm1 <- lm(Sepal.Length ~ X, data = iris)
iris_lm1 |>
  parameters() |>
  print_md()
```
### Let's see how that model looks:
```{r}
#| label: fig-iris-numeric-species-model
#| fig-cap: "Model of `iris` data with numeric coding of `Species`"
iris_plot1 <- iris |>
  ggplot(
    aes(
      x = X,
      y = Sepal.Length
    )
  ) +
  geom_point(alpha = .1) +
  geom_abline(
    intercept = coef(iris_lm1)[1],
    slope = coef(iris_lm1)[2]
  ) +
  theme_bw(base_size = 18)
print(iris_plot1)
```
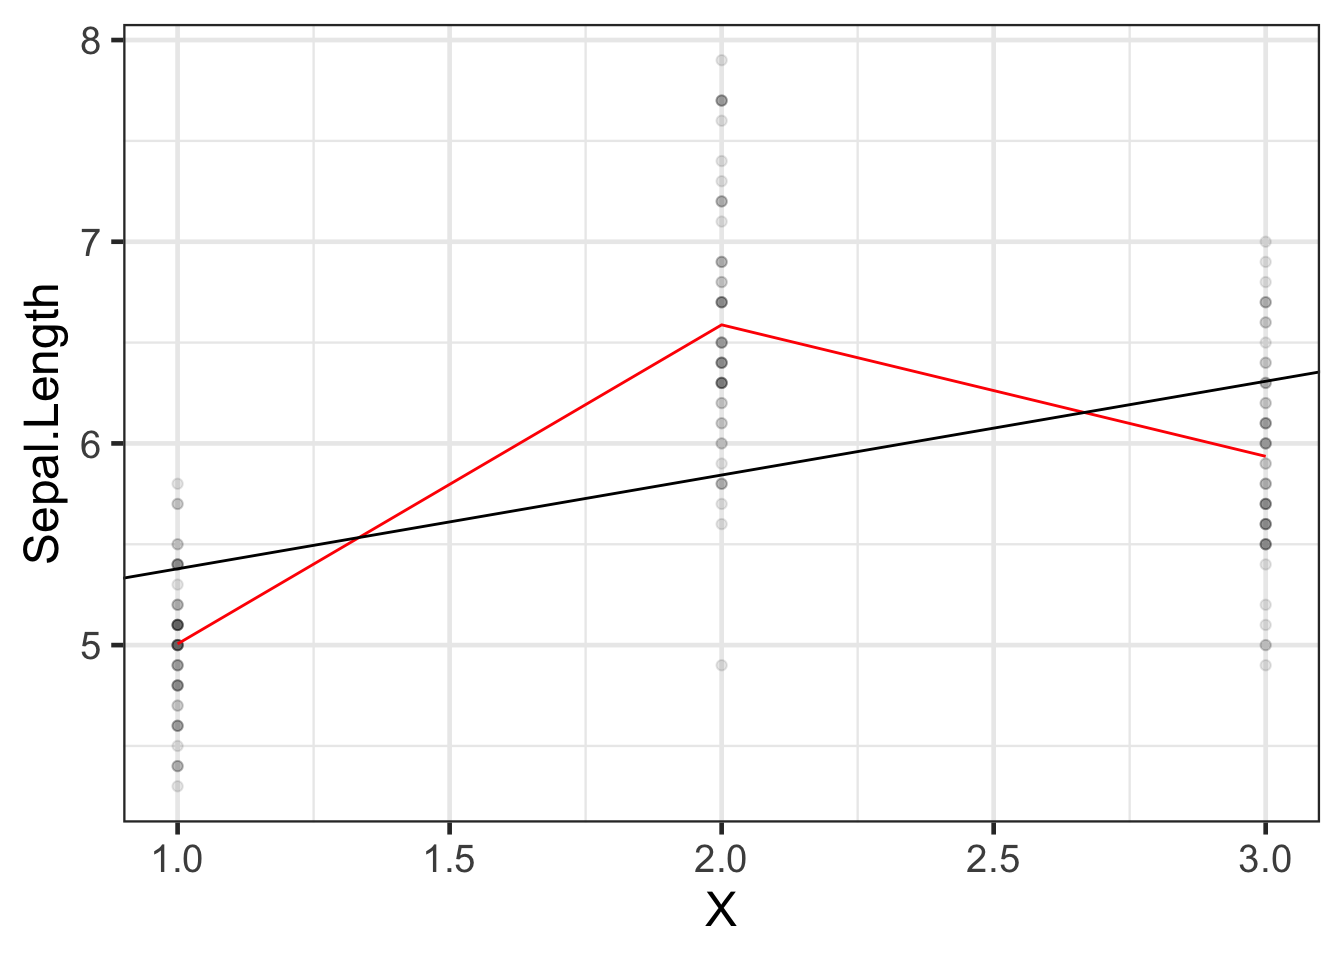
We have forced the model to use a straight line for the three estimated means. Maybe not a good idea?
### Let's see what R does with categorical variables by default:
```{r}
#| label: tbl-iris-model-factor1
#| tbl-cap: "Model of `iris` data with `Species` as a categorical variable"
iris_lm2 <- lm(Sepal.Length ~ Species, data = iris)
iris_lm2 |>
  parameters() |>
  print_md()
```
### Re-parametrize with no intercept
If you don't want the default and offset option, you can use "-1" like we've seen previously:
```{r}
#| label: tbl-iris-no-intcpt
iris_lm2_no_int <- lm(Sepal.Length ~ Species - 1, data = iris)
iris_lm2_no_int |>
  parameters() |>
  print_md()
```
### Let's see what these new models look like:
```{r}
#| label: fig-iris-no-intcpt
iris_plot2 <-
  iris |>
  mutate(
    predlm2 = predict(iris_lm2)
  ) |>
  arrange(X) |>
  ggplot(aes(x = X, y = Sepal.Length)) +
  geom_point(alpha = .1) +
  geom_line(aes(y = predlm2), col = "red") +
  geom_abline(
    intercept = coef(iris_lm1)[1],
    slope = coef(iris_lm1)[2]
  ) +
  theme_bw(base_size = 18)

print(iris_plot2)
```
### Let's see how R did that:
```{r}
#| label: tbl-iris-model-matrix-factor
formula(iris_lm2)
model.matrix(iris_lm2) |>
as_tibble() |>
unique()
```
This format is called a "corner point parametrization"
(e.g., in @dobson4e) or "treatment coding" (e.g., in @dunn2018generalized).
The default contrasts are controlled by `options("contrasts")`:
```{r}
options("contrasts")
```
See `?options` for more details.
---
```{r}
#| label: tbl-iris-group-point-parameterization
formula(iris_lm2_no_int)
model.matrix(iris_lm2_no_int) |>
as_tibble() |>
unique()
```
This format is called a "group point parametrization" (e.g., in @dobson4e).
There are more options; see @dobson4e §6.4.1 and the
[`codingMatrices` package](https://CRAN.R-project.org/package=codingMatrices)
[vignette](https://cran.r-project.org/web/packages/codingMatrices/vignettes/codingMatrices.pdf)
(@venablescodingMatrices).
## Ordinal covariates
(c.f. @dobson4e §2.4.4)
---
::: notes
We can create ordinal variables in R using the `ordered()` function^[or equivalently, `factor(ordered = TRUE)`].
:::
:::{#exm-ordinal-variable}
```{r}
#| eval: false
url <- paste0(
  "https://regression.ucsf.edu/sites/g/files/tkssra6706/",
  "f/wysiwyg/home/data/hersdata.dta"
)
library(haven)
hers <- read_dta(url)
```
```{r}
#| include: false
library(haven)
hers <- read_stata(fs::path_package("rme", "extdata/hersdata.dta"))
```
```{r}
#| tbl-cap: "HERS dataset"
#| label: tbl-HERS
hers |> head()
```
:::
---
::: notes
For ordinal variables,
we might want to use contrasts that respect the ordering of the categories.
The default treatment contrasts don't account for ordering.
:::
::: {.callout-note}
## Working with ordinal variables
When working with ordinal covariates in linear models:
1. Use `ordered()` or `factor(ordered = TRUE)` to create the variable
2. Consider using polynomial contrasts (`contr.poly`) which respect ordering
3. Alternatively, treat the ordinal variable as numeric if equal spacing is reasonable
4. Check `?codingMatrices::contr.diff` for additional contrast options
See @dobson4e §2.4.4 for more details on contrasts for ordinal variables.
:::
