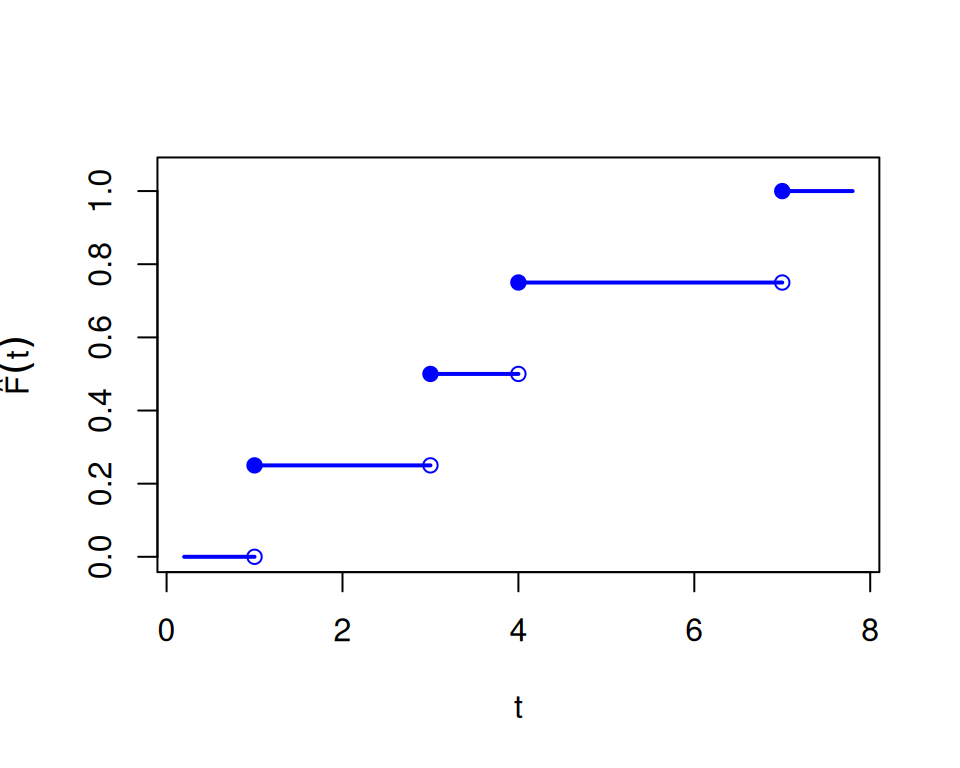
x <- c(4, 1, 7, 3)
n <- length(x)
x_ord <- sort(x)
p_ord <- seq_len(n) / n
ecdf_x_padding <- 0.8
eqf_y_padding <- 0.5
x_min <- min(x_ord) - ecdf_x_padding
x_max <- max(x_ord) + ecdf_x_padding
x_left <- c(x_min, x_ord)
x_right <- c(x_ord, x_max)
f_levels <- c(0, p_ord)
plot(
0,
0,
type = "n",
xlim = c(x_min, x_max),
ylim = c(0, 1.05),
xlab = "t",
ylab = expression(hat(plain("F"))(t))
)
segments(x_left, f_levels, x_right, f_levels, lwd = 2, col = "blue")
points(x_ord, f_levels[seq_len(n)], pch = 1, col = "blue")
points(x_ord, f_levels[seq_len(n) + 1], pch = 19, col = "blue")
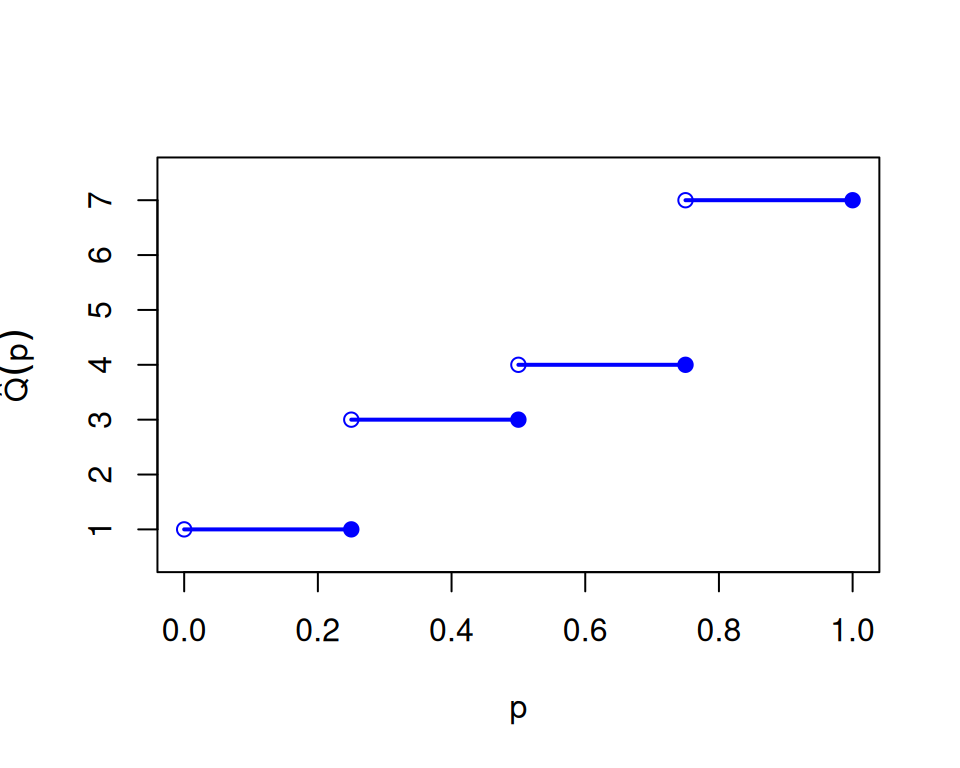
q_left <- c(0, p_ord[-n])
q_right <- p_ord
plot(
0,
0,
type = "n",
xlim = c(0, 1),
ylim = c(min(x_ord) - eqf_y_padding, max(x_ord) + eqf_y_padding),
xlab = "p",
ylab = expression(hat(Q)(p))
)
segments(q_left, x_ord, q_right, x_ord, lwd = 2, col = "blue")
points(q_left, x_ord, pch = 1, col = "blue")
points(q_right, x_ord, pch = 19, col = "blue")