nodes <- tibble::tribble(
~id, ~x, ~y, ~label,
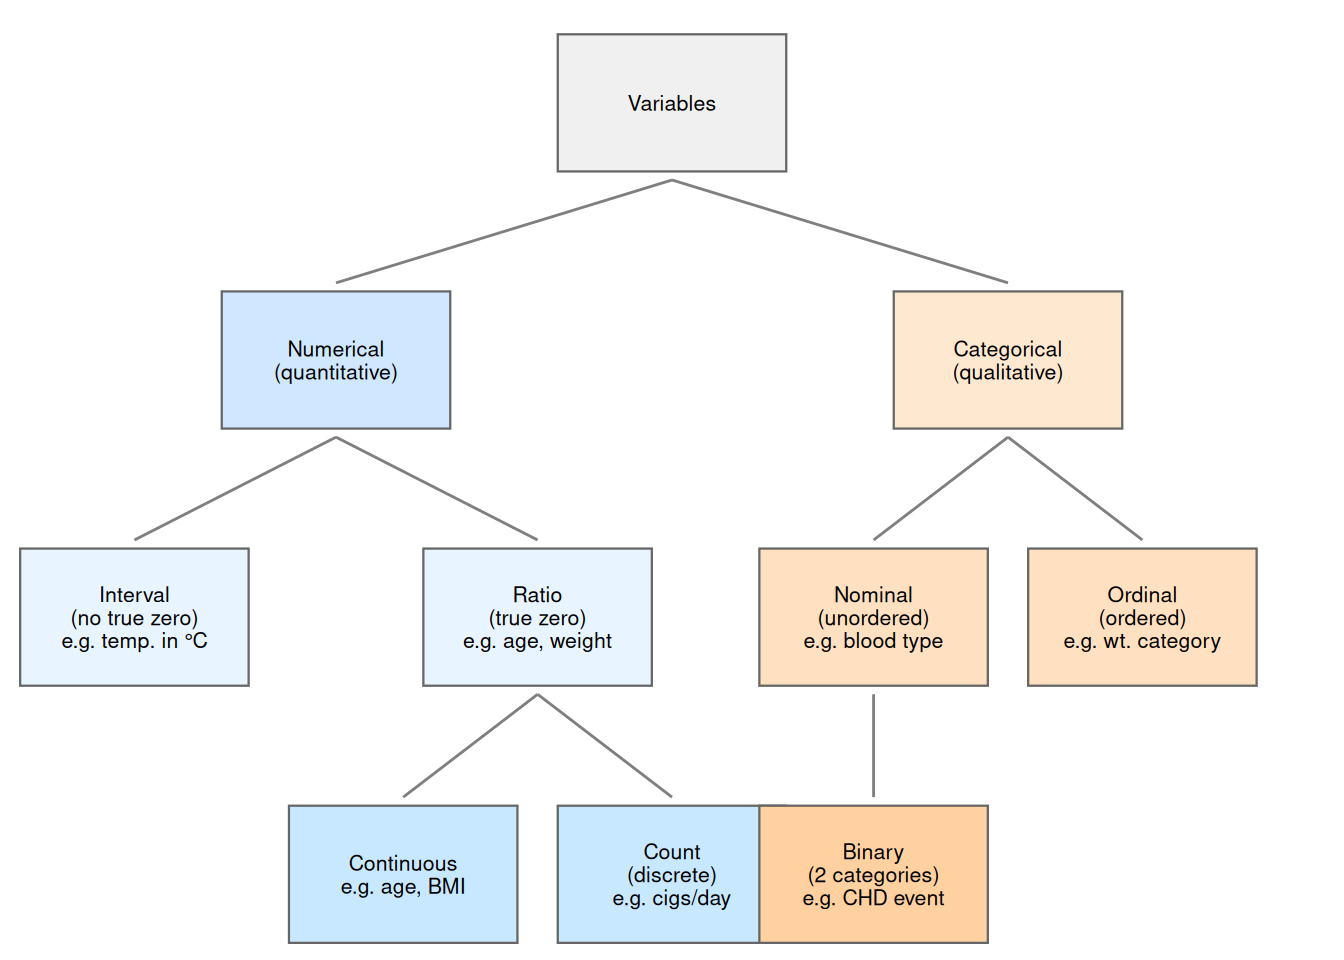
"V", 5, 4.5, "Variables",
"N", 2.5, 3, "Numerical\n(quantitative)",
"C", 7.5, 3, "Categorical\n(qualitative)",
"I", 1, 1.5, "Interval\n(no true zero)\ne.g. temp. in \u00b0C",
"R", 4, 1.5, "Ratio\n(true zero)\ne.g. age, weight",
"CT", 3, 0, "Continuous\ne.g. age, BMI",
"CNT", 5, 0, "Count\n(discrete)\ne.g. cigs/day",
"NOM", 6.5, 1.5, "Nominal\n(unordered)\ne.g. blood type",
"ORD", 8.5, 1.5, "Ordinal\n(ordered)\ne.g. wt. category",
"BIN", 6.5, 0, "Binary\n(2 categories)\ne.g. CHD event"
)
edges <- tibble::tribble(
~from, ~to,
"V", "N",
"V", "C",
"N", "I",
"N", "R",
"R", "CT",
"R", "CNT",
"C", "NOM",
"C", "ORD",
"NOM", "BIN"
) |>
dplyr::left_join(
dplyr::select(nodes, id, x, y),
by = c("from" = "id")
) |>
dplyr::rename(x_from = x, y_from = y) |>
dplyr::left_join(
dplyr::select(nodes, id, x, y),
by = c("to" = "id")
) |>
dplyr::rename(x_to = x, y_to = y)
fill_colors <- c(
"V" = "#f0f0f0",
"N" = "#d0e8ff", "C" = "#ffe8d0",
"I" = "#e8f4ff", "R" = "#e8f4ff",
"CT" = "#c8e8ff", "CNT" = "#c8e8ff",
"NOM" = "#ffe0c0", "ORD" = "#ffe0c0",
"BIN" = "#ffd0a0"
)
ggplot2::ggplot() +
ggplot2::aes() +
ggplot2::geom_segment(
data = edges,
ggplot2::aes(
x = x_from, y = y_from - 0.45,
xend = x_to, yend = y_to + 0.45
),
color = "grey50"
) +
ggplot2::geom_tile(
data = nodes,
ggplot2::aes(x = x, y = y, fill = id),
width = 1.7, height = 0.8,
color = "grey40", linewidth = 0.4,
show.legend = FALSE
) +
ggplot2::geom_text(
data = nodes,
ggplot2::aes(x = x, y = y, label = label),
size = 2.8, lineheight = 0.9
) +
ggplot2::scale_fill_manual(values = fill_colors) +
ggplot2::scale_y_continuous(
limits = c(-0.5, 5.1), expand = c(0, 0)
) +
ggplot2::scale_x_continuous(
limits = c(0, 10), expand = c(0, 0)
) +
ggplot2::theme_void()