
library(ggplot2)
ggplot(mtcars, aes(x = wt, y = mpg)) +
geom_point() +
labs(x = "Weight (1000 lbs)", y = "Fuel economy (mpg)") +
theme_minimal()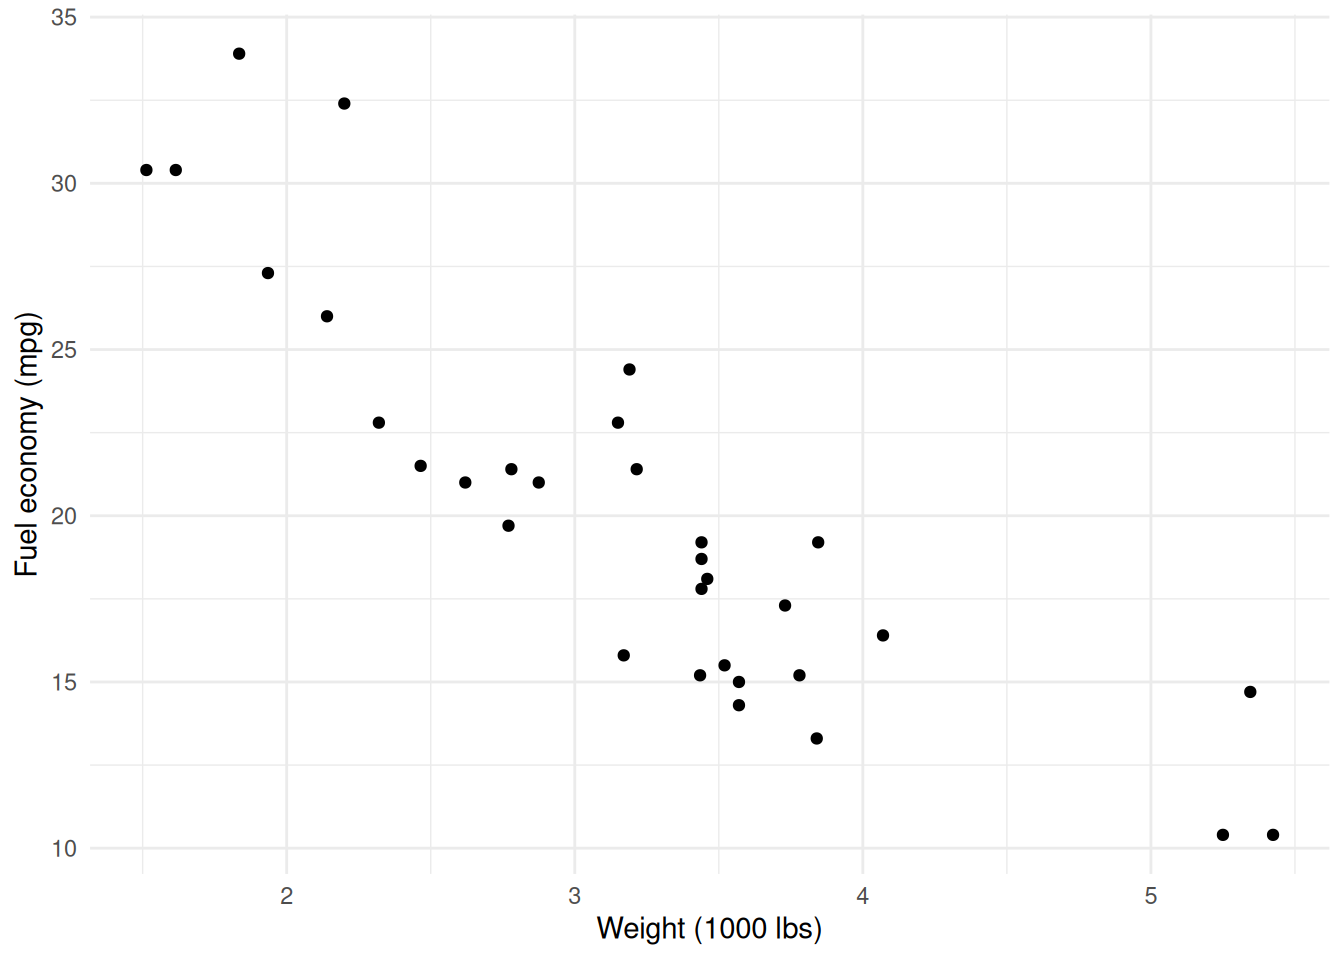
This is a template for creating manuscripts with Quarto. Replace this abstract with your own summary of the work: the research question, methods, key findings, and conclusions. Aim for 150–250 words for most journals.
template, quarto, manuscript
This is a Quarto manuscript template. The manuscript is available in multiple formats:
Cite references with @citationkey (Author 2024) or in parentheses (Author and Coauthor 2024).
Add background and motivation here. Cross-reference sections with @sec-methods (renders as Section 2).
Describe your study design, data sources, and analysis approach here.
You can include inline R code: the square root of 2 is 1.4142.
Code chunks execute and embed results:
In [1]:
summary(mtcars[, c("mpg", "wt", "hp")])
#>       mpg              wt              hp
#>  Min.   :10.40   Min.   :1.513   Min.   : 52.0
#>  1st Qu.:15.43   1st Qu.:2.581   1st Qu.: 96.5
#>  Median :19.20   Median :3.325   Median :123.0
#>  Mean   :20.09   Mean   :3.217   Mean   :146.7
#>  3rd Qu.:22.80   3rd Qu.:3.610   3rd Qu.:180.0
#>  Max.   :33.90   Max.   :5.424   Max.   :335.0
Supplementary analyses live in a separate notebook (notebooks/supplementary-analysis.qmd) and are embedded in the HTML output automatically.
Present your findings here. Reference figures with @fig-example (Figure 1) and tables with @tbl-summary (Table 1).
In [2]:
library(ggplot2)
ggplot(mtcars, aes(x = wt, y = mpg)) +
  geom_point() +
  labs(x = "Weight (1000 lbs)", y = "Fuel economy (mpg)") +
theme_minimal()Interpret your results, address limitations, and describe implications.
Summarize the key findings and their significance.