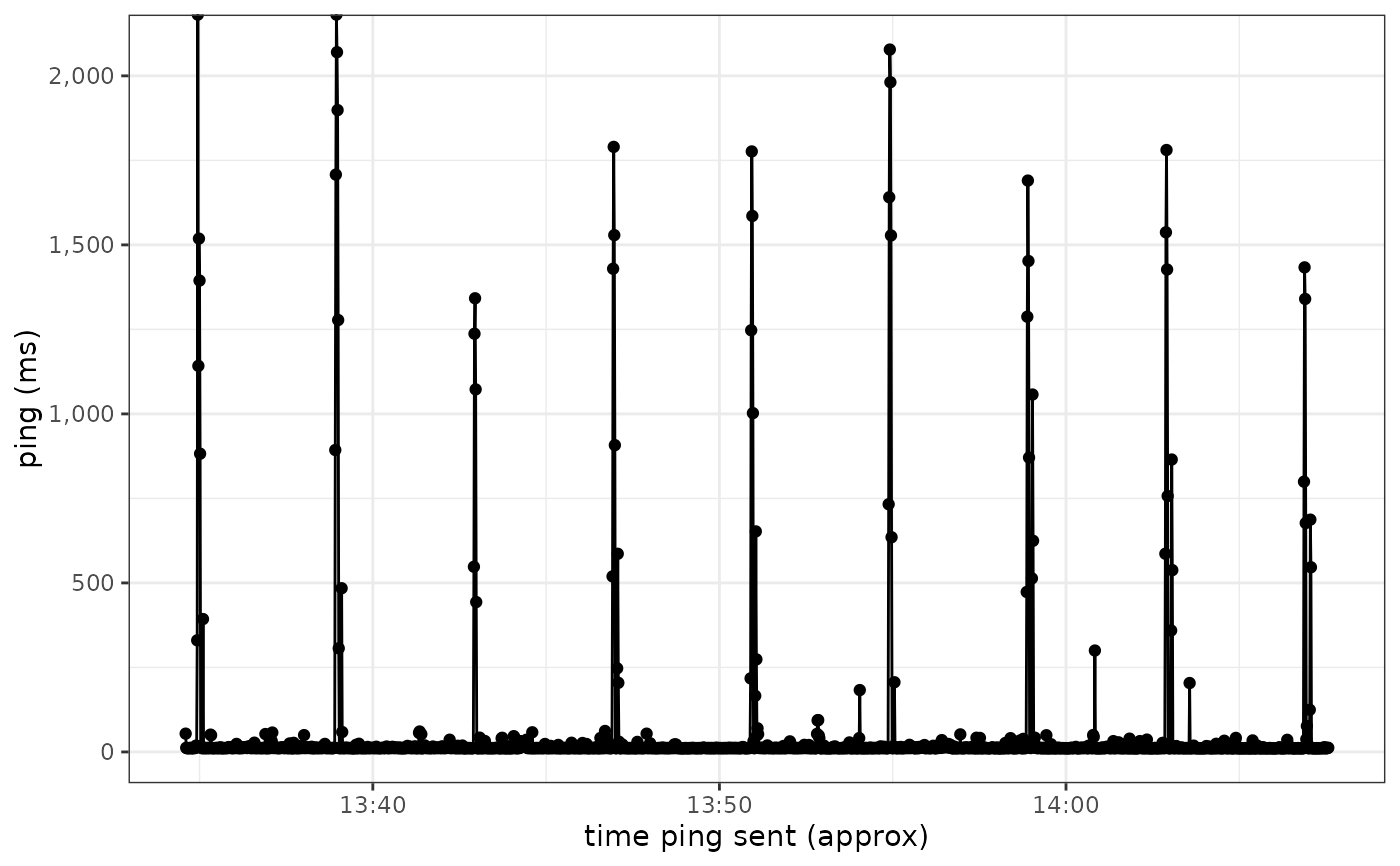
`autoplot()` method for `"pings"` objects
Usage
# S3 method for pings
autoplot(object, log_y = FALSE, ...)
Arguments
- object
a `"pings"` object created using [process_pings_file()]
- log_y
whether to display the y axis with logarithmic spacing
- ...
unused
Examples
fs::path_package(
  package = "ping",
  "extdata/data_2023-11-20.txt") |>
process_pings_file() |>
autoplot()
#> Extracted start time from first row of input file: 13H 34M 35S